

1. Introduction
Photocatalysis is widely adopted but faces challenges like low reaction rates, poor selectivity, and low efficiency [1]. A promising approach to address these limitations is the integration of photocatalysis with external fields. For instance, combining photocatalysis with thermal energy can accelerate molecular diffusion and improve product selectivity via electron-phonon coupling [2-4]. Coupling photocatalysis with an electric field can activate catalysts that are otherwise inactive [5]. Additionally, integrating photocatalysis with piezoelectric effects can achieve effective charge carrier dynamics control through the synergy of piezoelectric and semiconductor photoexcitation properties [6]. Overall, combining photocatalysis with external fields can overcome the limitations of single catalysis. Up until now, there are two types of photocatalysis coupled multi-field catalysis: one driven by external light sources [7], and the other driven by physical fields themselves, such as sonoluminescence [8], electroluminescence [9], and plasma luminescence [10]. The former and latter is referred to active photocatalysis and passive photocatalysis, respectively. The modulation of passive photocatalysis can increase the utilization of luminescence and is equally important for multi-field driven catalysis. Therefore, tuning passive photocatalysis and understanding the underlying mechanisms are crucial to maximize the synergistic advantages of multi-field catalysis.
Solution plasma has emerged as a novel catalytic technology in recent years [11-13]. The strong electric field, light emission, and shock wave effects within the plasma channel could effectively activates water, decomposing it into hydroxyl radicals, which then recombine to form H2O2[14-16]. As an electrically driven process, it shares the green feature of photocatalysis for H2O2 production [17-21]. Introducing semiconductor catalysts into the solution plasma channel can further enhance the catalytic activity. Notably, solution plasma displays luminescence across the UV to visible spectrum [22], making the passive photocatalysis an important consideration. However, the study of solution plasma catalysis is still in its infancy, and systematic studies on passive photocatalysis within solution plasma are lacking. Understanding how solution plasma and passive semiconductor photocatalysis can be integrated, and whether the design of semiconductor photocatalysts can improve passive photocatalysis for efficient H2O2 production in solution plasma, remains a critical research question. Addressing this will be crucial for advancing the practical applications of solution plasma driven reactions.
Photocatalysis is attracting increasing attention for H2O2 production [23-25]. TiO2 is the most classic photocatalyst, and studying its photocatalytic behavior in solution plasma serves as a representative case for discussing photocatalysis in plasma field. Although TiO2-based photocatalytic production of H2O2 has been widely reported [26], the decomposition of H2O2 on TiO2 surfaces remains a non-negligible issue [27]. Different TiO2 crystal phases exhibit varied behaviors concerning H2O2 decomposition. For instance, amorphous TiO2 can be dissolved in H2O2 to form complexes [28], while anatase TiO2 strongly adsorbs and decomposes H2O2[29], but to a lesser extent than amorphous TiO2. In contrast, bronze-phase TiO2 weakly adsorbs H2O2, facilitating its desorption and inhibiting its decomposition more effectively than other crystal phases. Studies have proven that the (001) facet of bronze-phase TiO2 is particularly advantageous for weak adsorption of H2O2[30]. Therefore, one-dimensional bronze TiO2 with c-axis orientation is ideal for inhibiting H2O2 decomposition and studying the synergistic effects in solution plasma driven production of H2O2.
In this work, we investigated the solution plasma-catalyzed production of H2O2 and explored the bronze TiO2 photocatalyst for improved photocatalysis in solution plasma. We developed two synthesis methods for bronze-phase TiO2 nanobelts, controlling the crystallinity of TiO2 through Na2Ti6O13 and Na2Ti3O7 precursor routes respectively and compared them with commercial crystal phases. The differences in the performance of H2O2 production from TiO2 were further analyzed through photocatalytic H2O2 production and decomposition experiments. The optimized bronze TiO2 nanobelts coupled with the discharge system resulted in the highest H2O2 yield, increasing by 696.8 μmol/L/h compared to the system without a catalyst. The accumulated concentration reached 3.7 mmol/L within 1 hour, which is currently the champion value for TiO2 photocatalytic systems. This developed approach opens novel avenues for the clean production of high-purity and high-concentration H2O2.
2. Experimental
2.1 Synthesis of bronze TiO2
Chemicals used was described in the supporting information. Bronze TiO2 was synthesized by proton exchange in sulfuric acid solution using sodium titanate as precursor.
Synthesis of sodium titanate: The mixture of Na2CO3 and P25 (the molar ratio of Na2CO3/TiO2 was 1:4 and 1:2.5, respectively) was fully ground with 2 g of NaCl and 0.5 g of Na2HPO4·12H2O for 20 min, and calcined in Muffle furnace at 825 ℃ for 8 h. The sintered samples were washed and freeze-dried. Finally, two different types of sodium titanate were obtained (Na2Ti6O13 and Na2Ti3O7, Figure S1).
Synthesis of bronze TiO2: First, 30 mL of 0.02 M H2SO4 solution with 0.05 g of Na2Ti6O13 powder were transferred to a 50 mL polytetrafluoroethylene reactor and heated at 170 ℃ for 96 h. After cooling to room temperature, the supernatant was removed, and the white sediment was washed with deionized water for several times until the solution was neutral. After filtration, the solution was freeze-dried. The obtained sample was named TiO2(B)-1. Secondly, 500 mL of 0.02 M H2SO4 solution with 0.05 g of Na2Ti3O7 powder were placed in a beaker and stirred at room temperature for 72 h. After filtering, repeat washing with deionized water for several times until the solution shows neutral. The freeze-dried sample was further annealed (450 ℃, 2 h), and finally the sample was named TiO2(B)-2.
2.2 Production of H2O2 by plasma-catalysis reaction system
The plasma-catalysis experimental apparatus as shown in Scheme 1, which is made up of four important parts: pulsed plasma generator, plasma-catalysis reactor, cooling circulating water and gas. The parameters of the pulsed plasma generator can be adjusted, in this study, the output pulse voltage was set as ± 3 kV, with a pulse frequency of 7 kHz and a pulse width of 3 μs. Two tungsten rods (diameter: φ = 3.0 mm, gap: 0.5 mm) are connected to both ends of the double-layer plasma reactor, which serve both as high voltage electrodes and as gas inflow channels. Prior to turning on the pulsed plasma generator, 100 ml of ultrapure water and 20 mg of catalyst were sonically dispersed in an ultrasonic pulverized for 30 min and then added to the plasma reactor. High purity gas (99.999%) was continuously added to the plasma reactor at a fixed flow rate of 1 L/min throughout the experiment. And the cooling circulating water maintains the temperature inside the reactor at 10 °C. The concentration of H2O2 were characterized using a UV-2600 Shimadzu UV spectrophotometer, refer to the support information for detailed testing procedures.
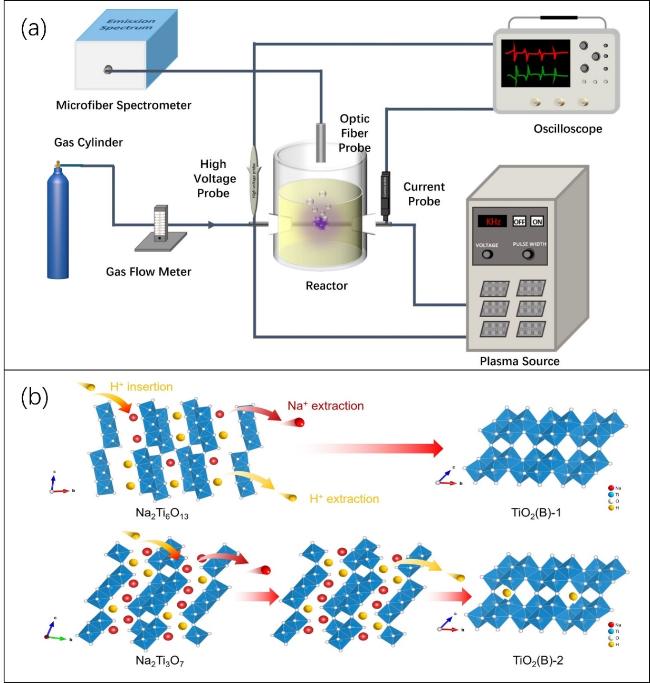
Scheme 1. (a) Schematic illustration of needle-type plasma-catalysis apparatus for the preparation of H2O2; (b) Insertion/Extraction mechanism of ions in the crystal structure of sodium titanate and the phase transition process to bronze TiO2. |
2.3 Plasma characterization
The concentration of H ions of solution was measured with a FE28-Standard Mettler pH meter (range: 0.00~14.00 pH, resolution: 0.01 pH, accuracy: ± 0.01 pH). The conductivity of the solution was collected using a LAQUA ES-71G act conductivity meter. Optical emission spectroscopy signal (OES) of liquid phase plasma were captured with a NOVA-EX 400-001-5685 Ocean Optics' fiber optic spectrometer. Electron spin resonance (ESR) signals of 5,5-dimethyl-1-pyrroline-n-oxide (DMPO) spin-trapped radicals were recorded using a Bruker EMXnano spectrometer at 298 K and 9.63 GHz. Using GWINSTEK GDS-2202A hybrid digital oscilloscope to acquire the values of pulse current and pulse voltage of liquid phase plasma at a high-speed sampling rate of 2 GS/s.
2.4 In-situ FT-IR spectra to distinguish the H2O2 adsorption on TiO2
First, the TiO2 catalyst was placed in an in-situ infrared diffuse reflectance cell. Under an argon gas flow, the catalyst was heated to 120°C to remove surface-adsorbed impurities. The infrared spectrum collected at this stage served as the background. Subsequently, high-purity Ar was bubbled through a porous gas washing bottle containing 30% H2O2, introducing H2O2 vapor into the gas-solid infrared diffuse reflectance cell. After flowing the gas for 30 minutes, UV light was turned on to irradiate the surface of TiO2, and infrared spectra were collected at various illumination times.
3. Results and discussion
Ensuring the efficiency of H2O2 generation while minimizing its decomposition is crucial for improving the photocatalysis in high-energy environments, such as plasma field. Due to the high reactivity of H2O2, it can readily react with the TiO2 surface, particularly when the surface is disordered. The preparation of highly crystalline TiO2, minimizing disorder and surface defects, is key to controlling H2O2 decomposition in TiO2 systems. Among the various phases of TiO2, bronze is notable for its unique properties. The diffusion coefficient of H2O2 on the representative (001) facet of bronze TiO2 is the highest [30], indicating the lowest degree of H2O2 decomposition. Traditional methods for synthesizing bronze TiO2 involve hydrogen ion exchange and dehydration of Na2TinO2n+1 precursors, typically limited to n=1-3[31,32]. These methods often result in TiO2 with defects and impurity phases, which can lead to a phase transition from bronze to anatase, reducing the ability to inhibit H2O2 decomposition. In this study, we developed a strategy utilizing an n=6 precursor, Na2Ti6O13. This precursor has a more ordered structure, better matching the bronze TiO2 crystal structure [33]. The interlayer tunnels in Na2Ti6O13 facilitate ion exchange and structural transformation to bronze TiO2.
3.1 Structural and morphological characterization of bronze TiO2
We investigated the structural evolution of sodium titanate precursors and their transformation to bronze TiO2. Figure 1a shows the XRD pattern of the precursor Na2Ti6O13 prepared by the molten salt method. The diffraction peaks at 2θ = 11.84°, 14.10°, 24.48°, 30.11°, 33.48°, 43.28°, 44.25°, and 48.58° correspond to the (200), (-201), (110), (-203), (402), (602), and (020) planes of monoclinic Na2Ti6O13 (PDF#73-1398) with lattice constants a = 1.5131 nm, b = 0.3745 nm, and c = 0.9159 nm. In contrast, Figure 1b presents the XRD pattern of the precursor Na2Ti3O7, also prepared by the molten salt method. The diffraction peaks at 2θ = 10.52°, 15.84°, 25.68°, 43.88°, and 66.87° correspond to the (100), (101), (110), (104), and (124) planes of monoclinic Na2Ti3O7 (PDF#72-0148) with lattice constants a = 0.8571 nm, b = 0.3804 nm, and c = 0.9135 nm. After proton exchange and dehydration, these sodium titanate phases undergo topotactic transformation to bronze TiO2. In Figure 1c, the diffraction peaks at 2θ = 14.19°, 15.20°, 17.44°, 24.93°, 28.61°, 29.70°, 30.67°, 33.19°, 43.50°, 44.50° and 48.53°correspond to the (001), (200), (20-1), (110), (002), (40-1), (400), (310), (003), (60-1), and (020) of monoclinic bronze TiO2 (JCPDS 46-1237), respectively. The sharp and narrow peaks indicate that TiO2(B)-1 has good crystallinity and high purity. In contrast, TiO2(B)-2 exhibits broad peaks and lacks the characteristic peaks at 2θ = 15.20° and 30.67° corresponding to the (200) and (400) planes of bronze TiO2. Additionally, the TiO2(B)-2 shows an unknown diffraction peak at 2θ=12.14°, indicating the presence of impurities. Therefore, XRD characterization indicates that we synthesized and controlled the crystal phase and crystallinity of bronze TiO2. The Na2Ti6O13 precursor can be used to synthesize bronze TiO2 with higher crystallinity and purity.
The difference between the two bronze TiO2 samples can be attributed to the crystal structures of the precursors, Na2Ti3O7 and Na2Ti6O13. Na2Ti3O7 contains three TiO6 octahedra connected by shared edges to form strip, which in turn share corners to create a serrated (Ti3O7)2- layer with an open lamellar structure [34]. In contrast, Na2Ti6O13 features TiO6 octahedra sharing edges along the c-axis, forming serrated layers that create larger quasi-rectangular tunneling spaces [35]. As illustrated in Scheme 2, the larger tunneling structure of Na2Ti6O13 can accommodate more amount of H2O and H3O+, and its stable physical structure can further improve the exchange rate of protons during the hydrothermal reaction. We conducted ICP elemental analysis on the sodium residue in the two bronze TiO2 samples (Table S1) and found that 98.87% of the sodium in the Na2Ti6O13 precursor could be exchanged, whereas only 69.76% of the sodium in the Na2Ti3O7 precursor could be exchanged. The ICP results further confirm that the residual sodium cations in TiO2(B)-2 lead to non-homogeneous dehydration reactions and partial distortion of the domain structure, resulting in the low crystallinity of TiO2(B)-2.
The Raman spectra exhibited sharp and intense peaks, indicating a well-ordered long-range structure and regular lattice arrangement. The Raman signals for Na2Ti6O13, shown in Figure 1d, match previously reported spectra [36]. A vibration peak at 137 cm-1 corresponds to the O-Ti-O bond, while characteristic peaks at 194 and 275 cm-1 are associated with the Na-O-Ti bond. Within the range of 400 cm-1 to 900 cm-1, various stretching vibration peaks of the TiO6 octahedron are observed, including a peak at 480 cm-1 corresponding to the Ti-O-Ti bond. The peak at 871 cm-1 is attributed to the stretching vibration of the short Ti-O bond coordinated with sodium ions and non-bridging oxygen. Figure 1e displays the Raman data for Na2Ti3O7, with a vibration peak at 147 cm-1 corresponding to the O-Ti-O bond, and characteristic peaks at 192 and 269 cm-1 for the Na-O-Ti bond. Similarly, within the 400 cm-1 to 900 cm-1 range, various stretching vibration peaks of the TiO6 octahedron are present, including a peak at 401 cm-1 for the Ti-O bond and a peak at 835 cm-1 for the short Ti-O bond coordinated with sodium ions and non-bridging oxygen [37]. Notably, a Raman signal at 101 cm-1 in Na2Ti3O7 is absent in Na2Ti6O13, highlighting structural differences between the two materials.
After proton exchange and dehydration, all Raman bands in Figure 1f of both samples are consistent with the vibrational modes Ag (144, 363.4, 405.4, 435, 472, 554, 634.7 cm-1) and Bg (122, 198.7, 238.5, 253, 663.4 cm-1) of bronze TiO2 [38]. Compared to TiO2(B)-1, the Raman peaks of TiO2(B)-2 are broader and less defined, further confirming the superior crystallinity of the TiO2(B)-1 material.
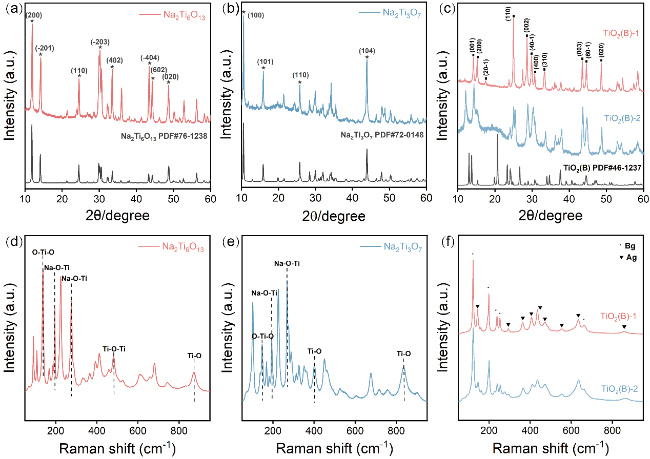
Figure 1. (a-c) XRD patterns of different samples; (b) Raman spectra of different samples. |
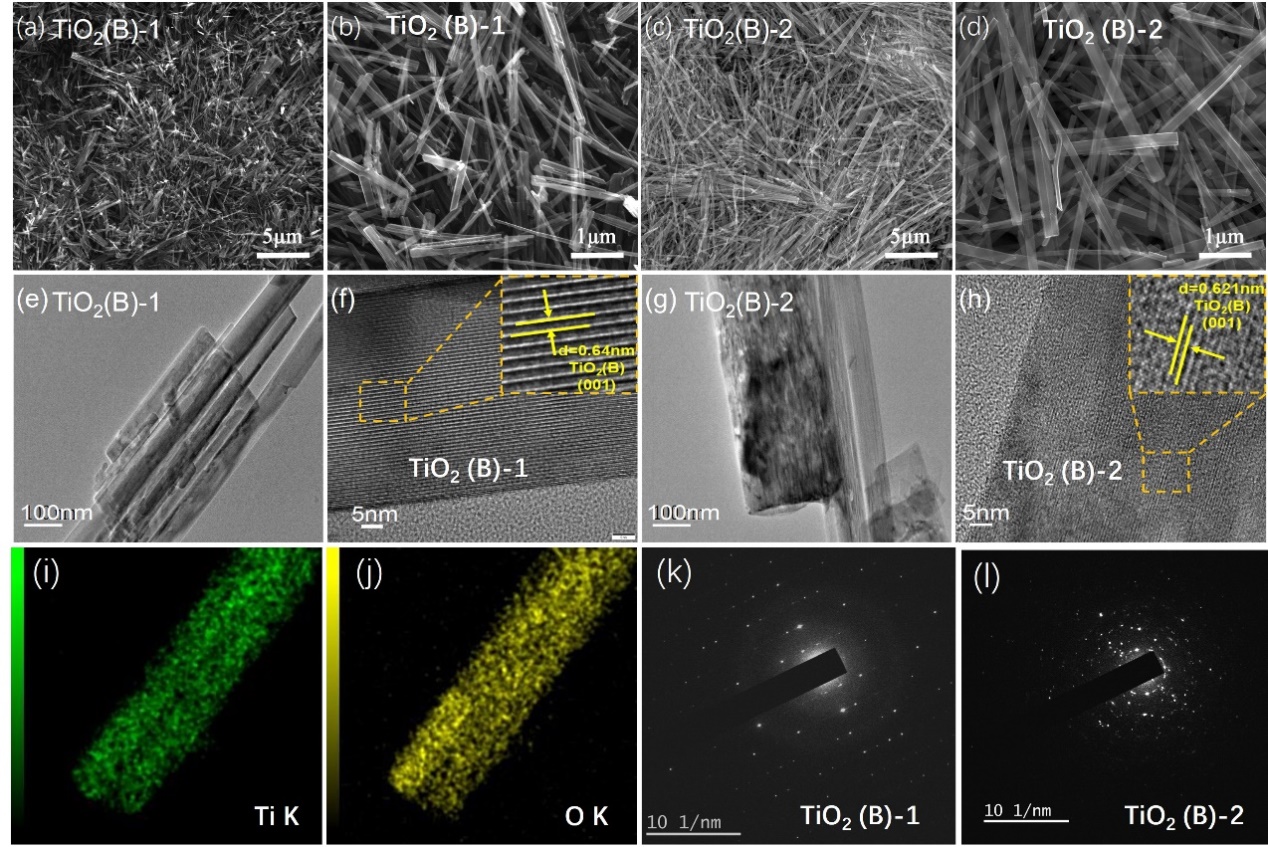
We further characterized the morphology and structure of the obtained bronze TiO2 using SEM, TEM, and HRTEM. Figures 2a-d show SEM images of the prepared bronze TiO2, revealing a one-dimensional structure the same to that of precursor (Figure S2). Both bronze TiO2 exhibit a nanobelt morphology, consistent with their precursors. This consistency is attributed to the topotactic transformation from sodium titanate to TiO2, where the monoclinic phase of sodium titanate favors the formation of monoclinic bronze TiO2[32]. The diameter of TiO2(B)-1 nanobelts ranges from 20 to 100 nm, with lengths extending to several micrometers. In contrast, the TiO2(B)-2 nanobelts have diameters ranging from 50 to 500 nm and lengths up to 30 μm. By comparison, the TiO2 nanobelts derived from Na2Ti3O7 display less uniformity compared to those from Na2Ti6O13. This discrepancy can be partially explained by the incomplete proton exchange in Na2Ti3O7 and the slightly lower lattice match between Na2Ti3O7 and bronze TiO2, leading to uneven internal stress during the topotactic transformation and resulting in less ordered TiO6 octahedral arrangements. High-resolution TEM results corroborate these observations. As shown in Figure 2e-h, TiO2(B)-1 exhibits a clearer lattice arrangement with a better-defined shape and smoother surface, indicative of its higher crystallinity. The lattice spacings of 0.64 nm for TiO2(B)-1 and 0.62 nm for TiO2(B)-2 correspond to the (0 0 1) crystal plane of bronze TiO2. The slight differences in observed lattice spacings are likely due to variations in the unit cell parameters of the sodium titanate precursors. The element mapping images of TiO2(B)-1 in Figure 2i,j confirms uniform distribution of Ti and O along the nanobelts. In Figure 2k, the well aligned spots in SAED pattern of an individual TiO2 nanobelts proves the highly crystalline nature of the TiO2(B)-1 nanobelt. In contrast, Figure 2l displays bright spots and a series of faint rings, suggesting that TiO2(B)-2 is partially crystallized. This crystallinity difference between TiO2(B)-1 and TiO2(B)-2 agrees with the XRD and Raman results in Figure 1.

Figure 2. SEM images of different samples: (a,b) TiO2(B)-1; (c,d) TiO2(B)-2. TEM and HRTEM images of different samples: (e,f) TiO2(B)-1; (g,h) TiO2(B)-2. (i,j) elemental mapping images of TiO2(B)-1. SAED pattern of (k) TiO2(B)-1; (l) TiO2(B)-2. |
3.2 H2O2 production by a single solution plasma system
We optimized the plasma discharge parameters for H2O2 synthesis via solution plasma by varying the gas environment (no gas (Wo), Ar, O2). As shown in Figure 3a, the presence of gases significantly increased the yield of H2O2. Specifically, the total yield increased by 5.42 times with O2 and 3.21 times with Ar compared to the absence of gas. Additionally, the yield with O2 was 1.68 times higher than with Ar. Accordingly, O2 bubbling significantly enhances the production of H2O2 through liquid-phase plasma discharge. Figure 3b shows a photo of the discharge spark during the liquid-phase plasma system. In the absence of gas, weak filamentary discharge channels form between the electrodes, resulting in a narrow plasma discharge area. However, the presence of gas significantly expands the plasma area. The discharge channel range is notably enhanced by the rupture of gas bubbles. Water molecules, being highly electronegative, absorb many electrons in the initial discharge stage, making it difficult to form an electron avalanche. Consequently, a large breakdown voltage is required to directly breakdown water and produce plasma. Gas bubbles, however, greatly reduce the breakdown voltage, resulting in a more intense high-energy plasma.
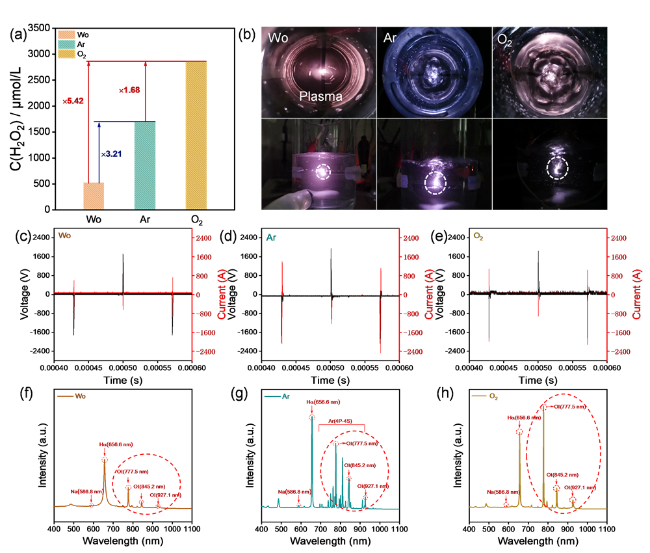
Figure 3. (a) Evaluation of the H2O2 yield of liquid-phase plasma at different atmospheres for 1 hour. (b) Schematic illustration of spark in liquid-phase plasma at different atmospheres. (c-e) Voltage and current signals of liquid-phase plasma (Parameters of the pulsed plasma generator: V = ±3 kV, f = 7 kHz, Δt= 3μs) at different atmospheres: (c) without gas; (d) Ar; (e) O2. (f-h) OES signal of liquid-phase plasma at different atmospheres: (f) without gas; (g) Ar; (h) O2. |
We further characterized and analyzed the effect of the gas on the plasma combining a digital oscilloscope and a fiber optic spectrometer to acquire the pulse current, pulse voltage signal, and emission spectrum of the atoms during the discharge. A 10 Ω resistor was connected in series within the plasma output circuit, and the actual pulse voltage and current generated during the discharge process were monitored using an oscilloscope. As shown in Figure 3c-e, the discharge of the system without gas is unstable, with significant fluctuations in the current value. After introducing gas, both current and voltage values increased, with voltage rising from ±1600 kV to ±2200 kV and current from 800 A to 2000 A. This indicates that the increase in H2O2 production after gas injection is partly due to changes in the discharge. The higher peak pulse voltage increases the energy injected into the electrode gap, raising the density of high-energy electrons and thus the frequency of electron collisions with ground-state neutral species, leading to the excitation of more active species and promoting H2O2 production.
We diagnosed the active species in the excited state within the plasma by optical emission spectroscopy (OES). To quantitatively compare the intensity of the emission spectra, we normalized the data based on the sodium atomic emission intensity of 100 μL of 10 M NaOH. As shown in Figure 3f, in the absence of gas, the plasma primarily ionizes to excite H2O molecules, with Hα atomic emission lines at 656.6 nm, O (3P5P0→3S53S0) at 777.5 nm and 845.2 nm (3P3P0→3S3S0), and OI atomic emission lines at 927.1 nm [39]. Figure 3g shows that when Ar is added, atomic emission spectra belonging to the 4P-4S orbitals of Ar appear in the range of 700-900 nm, along with increased intensity of the Hα and OI atomic emission spectra [40]. The presence of a large number of metastable Ar species with high excitation energy and long lifetime in the liquid increases the collision frequency of neutral gas molecules with free electrons, further promoting water ionization. As shown in Figure 3h, the most intense emission of oxygen atoms is observed when the system is filled with O2 compared to Ar, indicating a significant increase in the content of oxygen-active species within the solution. Additionally, the collision reaction of water molecules with excited-state oxygen atoms (O(ID)) can generate ∙OH, further promoting the synthesis of H2O2.
Besides, we have explored the effects of other gases, such as N2 and CO2, on H2O2 synthesis during the plasma discharge process. For the case of N2 atmosphere, discharge in N2 introduces nitrate and nitrite ions into the solution. The accumulation of these ions increases the solution conductivity, which destabilizes the plasma discharge and makes it unsustainable for H2O2 production. For the case of CO2 atmosphere, similarly, CO2 discharge leads to the formation of carbonate ions, which also raise the solution conductivity, resulting in unsustainable plasma discharge conditions.
3.3 H2O2 production by bronze TiO2 tuned photocatalysis in solution plasma
We have explored several plasma parameters on the production of H2O2, as shown in Figure S3. Increasing the pulse voltage enhances the energy input into the plasma, which promotes water dissociation and radical formation, thereby increasing H2O2 yield. However, when voltage is higher than 3 kV, the yield of H2O2 is hardly increased. The frequency of the pulse affects the rate at which radicals are generated and recombined, optimizing the conditions for H2O2 synthesis. Adjusting the pulse width balances the plasma discharge duration and relaxation period, impacting the stability and accumulation of H2O2. Through systematic optimization, we identified 3 kV, 7 kHz and 3 μS as the optimal conditions for maximizing H2O2 yield.
We further constructed a bronze TiO2 mediated plasma-catalytic system to produce H2O2 under oxygen bubbling conditions. As shown in Figure 4a, TiO2 nanobelts can be uniformly dispersed in water to form a slurry, ensuring sufficient contact between the plasma and TiO2. The introduction of oxygen bubbles further promotes the dispersion of the catalyst and plasma discharge, forming a solid-liquid-gas-plasma four-phase interface that maximizes the reaction efficiency. Evaluation of the H2O2 yield is shown in Figure 4b, where all TiO2 catalysts effectively promoted H2O2 synthesis compared to a single plasma system. Among them, the plasma-catalysis system using TiO2(B)-1 nanobelts had the highest yield, increasing by 352.2 μmol/L (P25), 642.6 μmol/L (TiO2(B)-2), and 696.8 μmol/L (TiO2(B)-1), respectively. We found that the high crystallinity TiO2(B)-1 nanobelts could effectively synergize with the liquid-phase plasma discharge technique to prepare H2O2. Remarkably, the maximum H2O2 concentration reached 3.5 mmol/L, which is 1-3 orders of magnitude higher than conventional TiO2 photocatalytic H2O2 production methods.
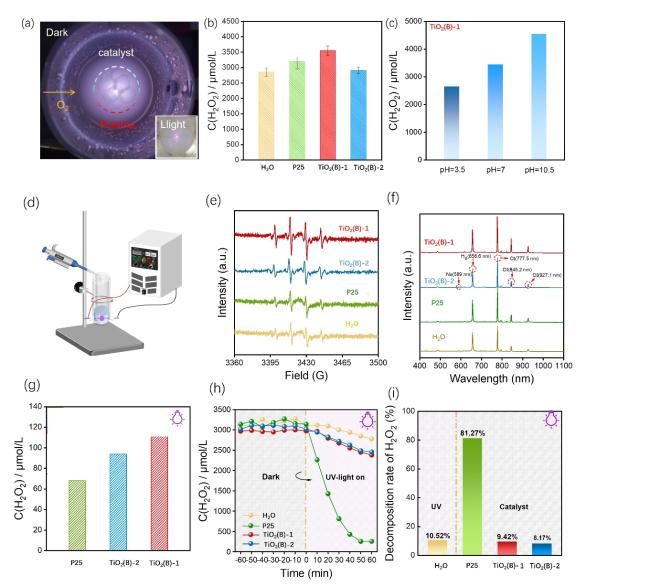
Figure 4. (a) Photo of TiO2 in solution plasma with gas-liquid-solid-plasma four-phase interfaces; (b) Evaluation of H2O2 yield with different catalysts in plasma-catalysis reaction system (Parameters: V = ±3 kV; f = 7 kHz; Δt= 3 μs; O2 = 1 L/min; (c) pH dependent production of H2O2 using TiO2(B)-1; (d) Schematic illustration of the detection of OH· radicals in plasma-catalysis reaction system; (e) detected DMPO- OH· signals by using different TiO2; (f) detected OES signals by using different TiO2; (g) photocatalytic production of H2O2 by different TiO2 (Intensity: 55 mW/cm-2; O2: 1 L/min; 3000µmol/L H2O2); (h) Time dependent photocatalytic degradation of H2O2 over different TiO2; (i) Comparison of H2O2 decomposition ratio by different TiO2. |
The activity of as-synthesized high crystallinity TiO2(B)-1 nanobelts outperforms TiO2(B) nanosheets and nanotube synthesized according to the literature [41,42], as well as single phase of anatase or rutile TiO2 (Figure S4). Moreover, the H2O2 concentration achieved by gas-phase plasma discharge is lower than that of solution plasma discharge. Even with array electrodes in gas-phase plasma discharge, the accumulation rate of H2O2 only reached 0.95 mM per hour, which is still below the performance of our solution plasma discharge method (Figure S5). We also conducted five long-term stability tests on the TiO2 (B) system, and all results showed no significant decrease in activity. This indicates that the bronze TiO2 system exhibits stable H2O2 accumulation activity during catalytic processes (Figure S6). These results reveal the efficiency of photocatalyst-mediated solution plasma for H2O2 synthesis, demonstrating its potential as a highly effective method for H2O2 production.
To analyze the main reaction pathways of the plasma-catalysis system and the effect of solution changes on products, we conducted comparative experiments using TiO2(B)-1 nanobelts at different pH levels. As shown in Figure 4c, alkaline solutions were more favorable for H2O2 synthesis. The yield of H2O2 at pH = 10.5 is 1.28 times higher than at pH = 7 and 1.7 times higher than at pH = 3.5. Since the alkaline solution provides larger amount of OH-, we believe that the production of H2O2 is partially contributed by OH- excited species.
We further examined the role of hydroxyl radicals (·OH) in the production of H2O2, serving as a crucial indicator for evaluating the production mechanism of H2O2. To quantify the ·OH content in the liquid phase, we employed DMPO as a trapping agent. We designed a micro plasma reactor (Figure 4d) to test the instantaneous radical content. Initially, 100 mL of deionized water and 0.020 g of catalyst were uniformly dispersed using an ultrasonic homogenizer. A 2 mL aliquot of the homogenized sample was then placed in the reactor. During discharge, 55 μL of DMPO was added, and the liquid was subsequently placed into a capillary tube to measure the trapped ·OH content. Figure 4e presents the ESR spectra of DMPO-·OH for different samples introduced into the plasma system. In a pure water environment, a characteristic ·OH signal with an intensity ratio of 2:2:1 was detected [43]. The trend in ·OH content across different systems is consistent with the H2O2 yield results. The introduction of catalysts enhanced the ·OH signal intensity, with the trend in ·OH content across different systems consistent with the H2O2 yield results. Furthermore, the pH-dependent catalytic activity suggests that the higher H2O2 yield under alkaline conditions likely originates from the abundant OH- ions, which combine with high-energy electrons in the plasma to generate a substantial amount of ·OH radical.
Figure 4f illustrates the OES spectra of the plasma-catalysis system. The spectral intensity of the plasma was significantly enhanced after the addition of P25, TiO2(B)-1 and TiO2(B)-2 compared to the catalyst-free system. Notably, the plasma-catalysis system using TiO2(B)-1 nanobelts exhibited the strongest atomic emission intensity (Table S2). The Hα and O atomic emission spectral lines indicated the densities of H and O species, respectively. The enhanced Hα signal peak confirmed that the increased discharge intensity led to greater dissociation of water molecules, while the enhanced OI signal peak indicated that more oxygen atoms were excited and further participated in the synthesis of H2O2[44]. This luminescence enhancement is associated with the promotion of plasma discharge by catalyst.
We also monitored the electrical parameters of the plasma generated during the discharge. Figure S7 shows that the voltage increased from approximately ±1900 V to about ±2100 V, and the current increased from 1600 A to 2000 A with the addition of the catalyst. The TiO2(B)-1 nanobelts induced the largest current and voltage during the solution plasma discharge, which correlated with the strongest luminescence observed. Therefore, bronze-phase TiO2 enhances plasma discharge, which significantly promotes water dissociation. The primary radical generated during water dissociation is ·OH. While plasma discharge also activates oxygen molecules, our comparative tracking of singlet oxygen and superoxide radicals showed no significant increase in their capture signals. Therefore, we conclude that ·OH are the dominant reactive species, consistent with most reports on plasma-catalytic H2O2 synthesis [45].
To evaluate the passive photocatalytic performance of the catalysts in solution plasma, a comparative experiment was conducted. The experimental conditions included a UV light intensity of 55 mW/cm2, 0.020 g of catalyst, an O2 flow rate of 1 L/min, and 20 mL of methanol solution as the sacrificial agent. As shown in Figure 4g, the photocatalytic H2O2 yields were highest for TiO2 (B)-1 nanobelts (111.42 μmol/L), followed by TiO2 (B)-2 nanobelts (94.101 μmol/L), and P25 nanoparticles (68.14 μmol/L). Bronze TiO2 exhibited superior catalytic effects compared to other crystalline phases, with TiO2 (B)-1 nanobelts achieving the highest H2O2 yield, 1.63 times greater than that of P25 nanoparticles. We compared the light absorption properties of different TiO2 samples, as shown in Figure S8. We found no consistent correlation between light absorption capacity and catalytic activity. That is, highly crystallized bronze TiO2 exhibited moderate light absorption intensity-lower than P25 but higher than weakly crystallized bronze TiO2-yet demonstrated the highest catalytic activity. Thus, we believe that light absorption is only one factor influencing photocatalytic effects, while surface H2O2 adsorption capacity and interaction with plasma discharge play more critical roles.
When H2O2 does not dissociate immediately from the catalyst surface, electrons migrating to the surface can reduce H2O2 to H2O. Additionally, TiO2 surfaces form Ti-OOH complexes with H2O2, promoting its decomposition under visible light irradiation. To investigate the diffusion behavior of H2O2 across different crystalline phases and exposed surfaces, we designed experiments to observe H2O2 decomposition under UV light. Figure 4h shows the decomposition effect of H2O2 with the catalyst under UV irradiation. Upon UV exposure, H2O2 decomposed gradually. In pure water, the decomposition rate was 10.52%, while both TiO2-based catalysts exhibited slow decomposition rates. Notably, P25 showed the highest H2O2 decomposition ability, achieving an 81.27% decomposition rate under UV light. These differences are attributed to the exposed (001) crystal plane of bronze TiO2, which facilitates excellent H2O2 desorption, leading to a decrease in the decomposition rate. This can be also supported by the results in the literature [30]: On one hand, the diffusion coefficient of H2O2 on the surface of bronze-phase TiO2 is significantly higher than that on anatase-phase TiO2. This indicates that H2O2 desorbs more readily from the bronze-phase TiO2 surface, which is beneficial for suppressing its decomposition. On the other hand, the adsorption heat of H2O2 on bronze-phase TiO2 (11.3 kJ/mol) is notably lower than that on bronze/anatase TiO2 heterojunctions (19.4 kJ/mol). A higher adsorption heat corresponds to stronger adsorption of H2O2 on the TiO2 surface. Therefore, the lower adsorption heat of H2O2 on bronze-phase TiO2 compared to anatase-phase TiO2 suggests weaker adsorption of H2O2. Besides, we conducted a radial distribution function analysis of the O-O distance distribution from the AIMD results of H2O2 on the TiO2 surface. The molecular dynamics simulation of H2O2-TiO2(B) and H2O2-anatase TiO2 configuration are depicted in Figure 5a and c. Figure S9 indicates that their kinetic structural relaxations reach a steady state. The simulation results are displayed in Figure 5b. The peak around 1.3 Å corresponds to the O-O bond length in H2O2. By analyzing the g(r)-r relationships, we can effectively compare the stability of H2O2 molecules on different TiO2 surfaces. Upon comparison, we observe that the proportion of stable H2O2 molecules on the TiO2(B) surface is significantly higher than that on the anatase phase of TiO2, which is revealed by a higher value of g(r) for TiO2(B). This indicates that after kinetic relaxation, TiO2(B) retains more H2O2 on its surface, which is more favorable for stabilizing H2O2.
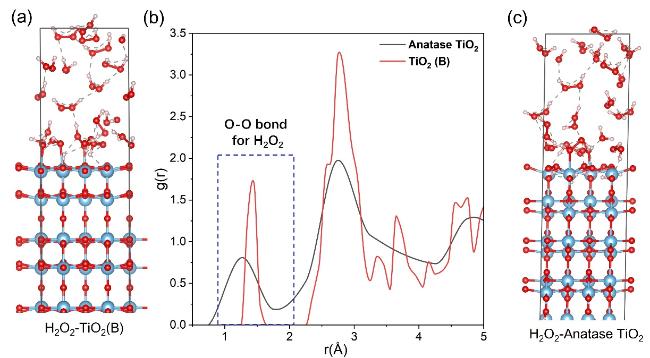
Figure 5. (a) Molecular dynamics simulation of H2O2-TiO2(B) configuration; (b) Radial distribution function of the O-O bond length for H2O2-TiO2 systems; (c) Molecular dynamics simulation of H2O2-anatase TiO2 configuration. |
To further investigate the regulation of H2O2 synthesis kinetics by the TiO2 catalyst, we performed a pre-saturation of H2O2 adsorption onto the TiO2 samples. Following this, ultraviolet light was applied, and in-situ infrared spectroscopy was used to track the H2O2 adsorption and desorption capabilities of different samples under UV illumination. As shown in Figure S10a, after the TiO2 (B) sample adsorbed H2O2, it exhibited two distinct types of infrared absorption bands. We regarded the bands near 3450 cm-1 as a ν(OH) mode of isolated H2O [46]. Additionally, we observed two weak absorption bands around 3600 and 3700 cm-1, which correspond to the infrared absorption bands of H2O2, indicating weak adsorption of H2O2 on the TiO2(B) surface. After UV illumination, the intensity of the H2O2 absorption bands rapidly decreased, indicating desorption of H2O2 from the TiO2(B) surface. When the sample was switched to P25 TiO2, as shown in Figure S10b, we observed two very strong absorption bands at 3600 and 3700 cm-1, which are characteristic absorption bands of H2O2 [47]. Notably, these bands did not show significant attenuation after UV illumination, demonstrating strong adsorption of H2O2 on P25 TiO2, with no desorption occurring under UV light. This irreversible adsorption of H2O2 on P25 TiO2 is unfavorable for the accumulation of H2O2 in solution. This further confirms our previous observations that P25 TiO2 readily photocatalyzes the decomposition of H2O2, while TiO2(B) does not facilitate such decomposition.
3.4 Enhanced H2O2 production by bronze TiO2@C in solution plasma
In our study, significant differences were observed in the photocatalytic decomposition of H2O2 on the surfaces of bronze and P25 TiO2. While the bronze surface inhibited H2O2 decomposition, the P25 TiO2 surface did not exhibit this behavior. To further investigate the unique properties of the bronze surface, we coated both materials with carbon. The carbon coating serves to isolate H2O2 from direct contact with TiO2, thereby inhibiting its decomposition. The carbon coating method is depicted in Figure S11. Raman spectroscopy was employed to characterize the carbon-modified TiO2 (B) samples. Figure S12 shows the Raman spectra of TiO2 (B)-1@C nanobelts. The spectra revealed two broad peaks corresponding to carbon nanostructures: the D band at 1364 cm-1, indicative of graphite carbon edge vibrations, and the G band at 1585 cm-1, corresponding to the in-plane stretching vibrations of graphite crystals[29]. XRD analysis confirmed that the crystal lattice structure of TiO2(B) remained unchanged after hydrothermal carbonization. UV-Vis diffuse reflectance spectra showed that TiO2(B)-1 turned from white to brown after carbonization, exhibiting strong light absorption in the 400-800 nm visible region. XPS spectra also reveals the existence of carbon related peaks on TiO2 (Figure S13). Combining the XRD, Raman data and XPS, we successfully demonstrated the loading of carbon on the material surface. This result was also validated through surface analysis of carbonized P25 (Figure S14). Figures 6a and b further confirmed the presence of a carbon layer on the TiO2 surface. After carbon coating, the H2O2 content mediated by TiO2 in solution plasma catalysis increased further (Figures 6c, d). Photocatalytic experiments revealed that the carbon coating further inhibited the decomposition of H2O2(Figures 6e, f). Notably, the photocatalytic decomposition of H2O2 on the carbon-coated P25 surface was almost equivalent to that on bronze TiO2, indicating that the carbon coating mitigated the disadvantage of P25 in H2O2 decomposition. We compared the pH and conductivity of the liquid-phase discharge system when using TiO2@C as a catalyst and observed no significant differences (Figure S15). This aligns with the similar H2O2 accumulation capabilities of bronze TiO2 and P25 after carbon loading. Additionally, this indirectly supports the unique characteristics of the brookite TiO2 surface. These findings demonstrate the importance of surface crystalline composition in the photocatalytic decomposition of H2O2 and provide valuable insights for designing TiO2 or other catalysts suitable for H2O2 production in solution plasma environments.
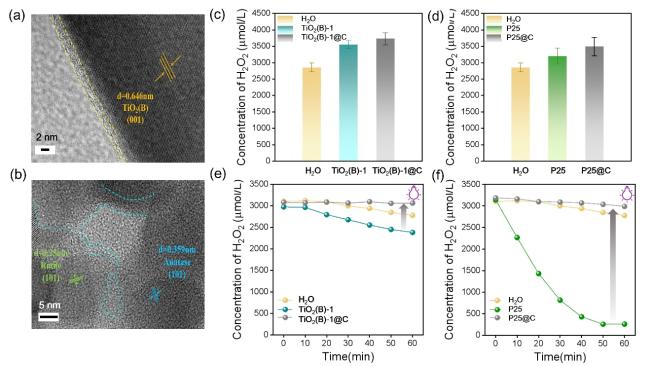
Figure 6. (a) TEM and HRTEM of TiO2(B)@C; (b) TEM and HRTEM of P25@C; (c) Solution plasma production of H2O2 mediated by TiO2(B)@C; (d) Solution plasma production of H2O2 mediated by P25@C;(e) Comparison on photocatalytic degradation of H2O2 at TiO2(B) and that after carbon coating; (f) Comparison on photocatalytic degradation of H2O2 at P25 TiO2 and that after carbon coating. |
We also analyzed the carbon loading of two samples and found that both had comparable carbon content (ca. 50 atomic%). However, their specific surface areas showed a significant difference, P25 TiO2 exhibited a specific surface area of 53.5 m2/g, while TiO2 (B) had only 28.1 m²/g. This indicates that although TiO2 (B) has a smaller surface area, its carbon coating is likely thicker. Such carbon coating not only affects the UV absorption characteristics of TiO2 but may also partially weaken TiO2 (B)'s ability to inhibit H2O2 decomposition. The carbon coating layer could alter the surface electronic structure or light absorption behavior, further influencing its catalytic performance.
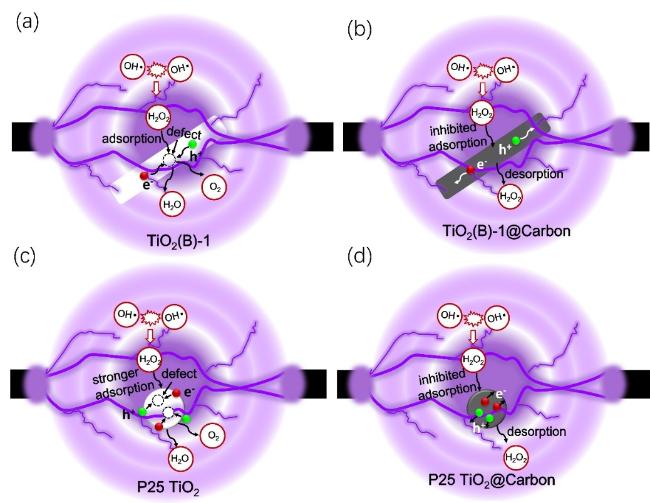
Based on the above results, the production and decomposition trend of H2O2 over bronze TiO2, P25, TiO2(B)@C and P25@C was illustrated in Figure 7. During plasma discharge in water, hydroxyl radicals are generated. When bronze-phase TiO2 is introduced into the solution plasma (Figure 7a), the TiO2 nanobelt structure acts as a medium, enhancing plasma discharge and luminescence, thereby generating more hydroxyl radicals and promoting H2O2 formation via hydroxyl radical pathways. Additionally, TiO2 absorbs UV photons from the plasma channel, preventing the decomposition of the generated H2O2. Photogenerated electrons and holes in TiO2 can react with oxygen bubbles and water molecules, respectively, to produce H2O2, thus improving the utilization of plasma energy. Additionally, the decomposition of H2O2 is particularly problematic in complex fields, especially under high-energy plasma conditions. Here, bronze-phase TiO2 not only facilitated the photocatalytic generation of H2O2 but also inhibited its decomposition. We improved passive photocatalysis in the solution plasma channel through three routes. Firstly, by adjusting the crystalline phase of TiO2 (Figure 7a,c), it was found that mixed-phase TiO2 (anatase/rutile) significantly promoted the photocatalytic decomposition of H2O2, attributed to the stronger adsorption of H2O2 on the anatase surface. In contrast, bronze-phase TiO2 significantly inhibited the photocatalytic decomposition of H2O2. Secondly, by optimizing the crystallinity and purity of the bronze-phase TiO2, higher-quality growth resulted in enhanced photocatalytic activity, favoring H2O2 generation. Thirdly, a uniform carbon layer is coated on the surface of TiO2 (Figure 7b,d). The carbon coating can further inhibit the adsorption of H2O2 on the catalyst surface, which also facilitates the desorption of H2O2 from the surface. The moderate strength of adsorption and desorption mediated by the carbon layer promotes the accumulation of H2O2 concentration during plasma discharge catalysis.
Figure 7. Mechanism diagram for the production of H2O2 by plasma-catalysis system with different TiO2 and TiO2@carbon. |
Last, note that the enhancement of plasma catalytic activity by TiO2 compared to pure water is not expected several times in other catalytic system, which can be attributed to the inherent constraints of oxide systems. High concentrations of H2O2 tend to react with oxide surfaces, forming peroxides and reducing catalytic efficiency. Additionally, the intense energy of plasma is difficult to control, meaning the improvement in catalytic activity is less pronounced than in other catalytic processes, such as electrocatalysis or photocatalysis, which often achieve orders-of-magnitude enhancements [48,49]. In plasma-catalyst interactions, even a 50% increase in catalytic activity is considered a significant improvement due to the challenges of synergistic effects between plasma and catalysts. Additionally, the plasma catalysis method currently faces challenges such as high energy consumption. However, embracing renewable energy sources and utilizing off-grid options like surplus wind, solar, and electricity can mitigate these issues. Moreover, modular power combinations can facilitate scaling up for industrial production. In terms of H2O2 production, plasma catalysis achieves concentrations several orders of magnitude higher than single photocatalysis. While it still lags behind electrocatalysis, plasma catalysis eliminates the need for electrolytes and subsequent separation processes. Therefore, despite current challenges like energy consumption, its advantages-such as eliminating electrolytes and achieving high H2O2 concentrations-highlight its potential as a scalable and eco-friendly solution, particularly when integrated with renewable energy systems.
4. Conclusion
In summary, we have developed a clean method for H2O2 production using a solution plasma approach. By utilizing the luminescence of the solution plasma field and introducing a suitable photocatalyst, we have achieved enhanced catalytic performance through the synergy of solution plasma and photocatalysis. Bronze-phase TiO2 nanobelts were prepared using two precursor routes, Na2Ti6O13 and Na2Ti3O7. These nanobelts not only promote plasma discharge but also effectively prevent the photocatalytic decomposition of H2O2 on the titanium oxide surface, distinguishing them significantly from traditional TiO2. The high-crystallinity, high-purity TiO2 nanobelts prepared via the Na2Ti6O13 route exhibited superior synergistic catalytic advantages, achieving an H2O2 production rate of 3.5 mmol/L/h. This rate is not only the highest concentration value for TiO2 photocatalytic H2O2 production but also exceeds traditional photocatalytic H2O2 production rates by 1-3 orders of magnitude. This work provides a valuable reference for studying photocatalysis and synergistic catalysis under complex fields, offering promising avenues for future research in optimizing photocatalytic processes and enhancing catalytic efficiency.
Declaration of competing interest
The authors declare that they have no known competing financial interests or personal relationships that could have appeared to influence the work reported in this article. Changhua Wang is an Editorial Board Member of this journal and he was not involved in the editorial review or the decision to publish this article.