

1. Introduction
Hydrogen peroxide (H2O2) has undergone a century of industrial development,[1-6] evolving from the early anthraquinone process laboratory trial in the 1930s to the mature large-scale production technology that currently dominates the global market, with the global annual output exceeding 5 million tons and a sustained annual demand growth rate of 5~8% driven by the green transformation of various industries.[7-9] Diverse application fields exhibit distinct market demand characteristics for H2O2: the chemical synthesis and pulp bleaching industries require high-concentration H2O2 (30~70 wt%) for continuous production,[10-14] while water treatment, antibacterial disinfection, and green agriculture favor on-site produced low-to-medium concentration H2O2 (0.1~10 wt%) with low transportation and storage costs.[15-19] In addition, the emerging fields such as electro-Fenton reaction for pollutant degradation and fuel cell power generation put forward higher requirements for the in-situ preparation capacity and purity of H2O2, which cannot be met by the traditional centralized production mode.[4,5,7]
And the current H2O2 synthesis technologies are facing prominent core bottlenecks in industrial scale-up, cost control and scenario adaptability, which seriously restrict the efficient utilization of H2O2 in various fields. Since the mid-20th century, the anthraquinone process has dominated industrial H2O2 production, accounting for over 95% of global output due to its ability to produce high-concentration H2O2 (30-70%).[20-23] This process relies on the hydrogenation-oxidation cycle of 2-ethylanthraquinone and exhibits high technical maturity. However, amid the escalating emphasis on sustainable development, its inherent drawbacks have become increasingly prominent: (1) It requires high-temperature and high-pressure conditions, coupled with precious metal catalysts (e.g., Pd/Al2O3), leading to substantial equipment costs and energy consumption; (2) It depends on organic solvents (e.g., heavy aromatics), which pose risks of organic wastewater pollution; (3) The product necessitates complex extraction-distillation purification and cannot be prepared on-site, introducing explosion hazards during transportation.
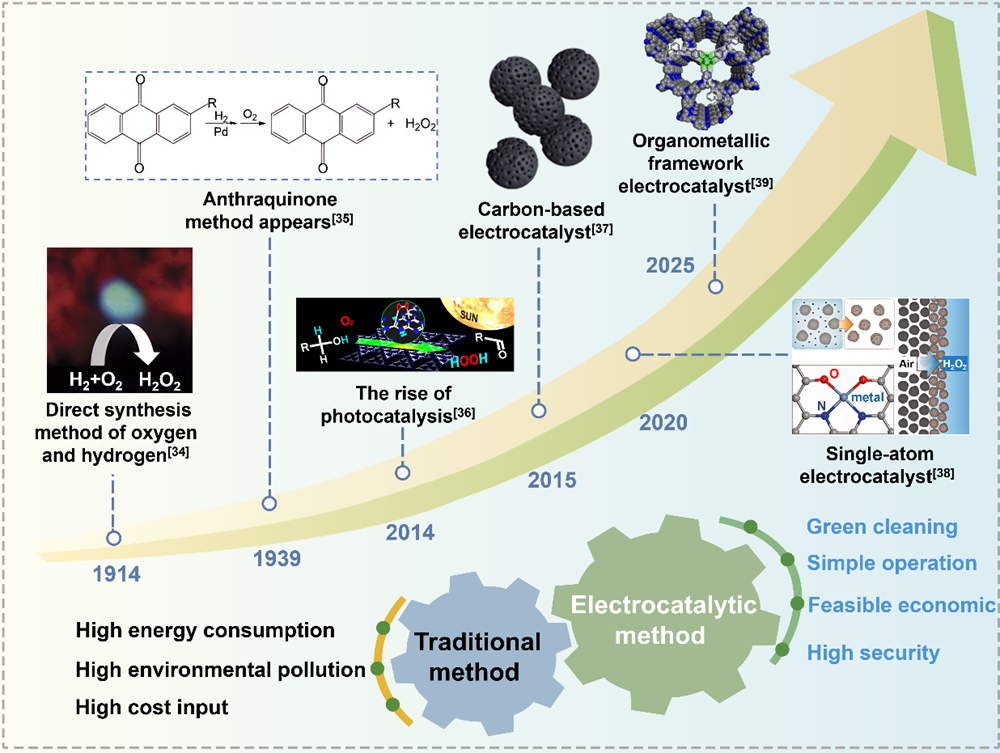
Other alternative synthesis methods also suffer from limitations. The direct H2O2 synthesis method (via direct reaction of H2 and O2) avoids organic solvents but faces severe explosion risks in H2/O2 mixtures and low catalyst selectivity. The photocatalytic synthesis leverages solar energy but is constrained by rapid recombination of photogenerated carriers and low reaction efficiency, remaining confined to laboratory-scale research.[24-26] In this context, the electrocatalytic 2e⁻ ORR has emerged as a research hotspot due to its green and safe nature.[27,28] Figure 1 illustrates the number of publications and citations for this catalytic approach in the Web of Science database. This technology can realize the continuous decentralized production of H2O2 under mild conditions, [29,30] which not only reduces the cost and safety hazards of H2O2 storage and transportation, but also use renewable energy for on-site production on demand. Characterized by green, environmental friendliness, cost-effectiveness, and safety, it stands as a highly promising H2O2 synthesis approach.[31,32] The evolutionary timeline of H2O2 synthesis technologies is illustrated in Figure 2.[33-38]
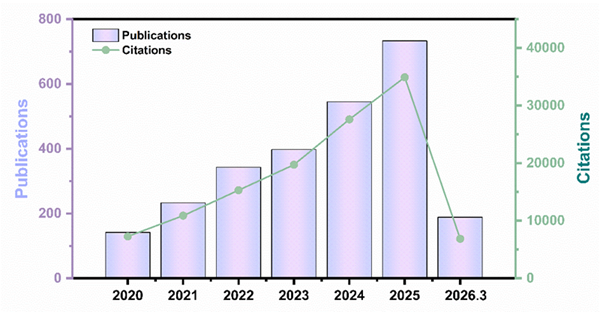
Figure 1. Annual publication and citation trends of research on electrocatalytic H2O2 production via two-electron oxygen reduction reaction over the recent 5 years. (Data source: Web of Science Core Collection. data for 2026 are as of March 2026) |
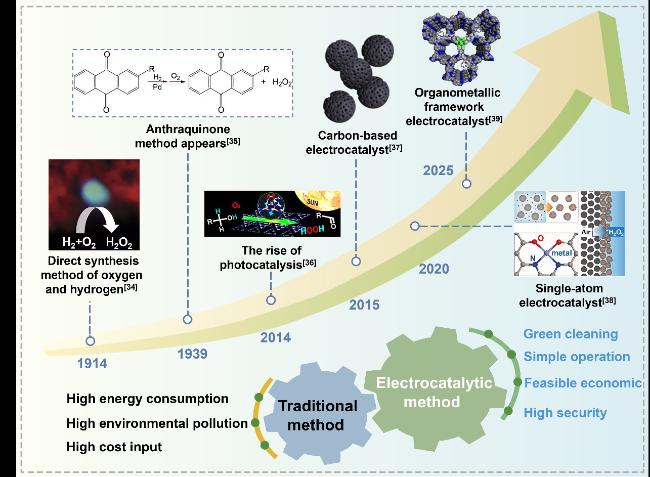
Figure 2. Innovation timeline of H2O2 preparation technology. Some inset figures are reproduced from ref.[33] (Copyright 2008, Royal Society of Chemistry), ref.[34] (Copyright 2021, Wiley-VCH), ref. [35] (Copyright 2014, ACS Publications), ref.[36] (Copyright 2015, Elsevier), ref.[37] (Copyright 2020, Wiley-VCH), ref.[38] (Copyright 2024, Wiley-VCH) |
Therefore, designing 2e⁻ ORR catalysts with high activity, high selectivity, and long stability remains a core challenge in this field. This review focuses on summarizing the latest advances in electrocatalytic 2e⁻ ORR for H2O2 production and applications (Figure 3). It emphasizes the current bottlenecks and innovative directions, which provides references for fundamental and industrial research.
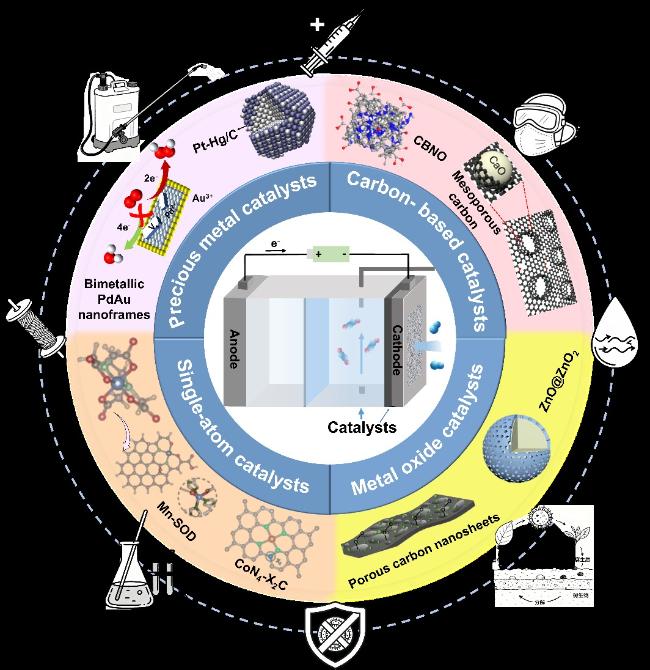
Figure 3. Core catalytic materials for electrocatalytic H2O2 production and H2O2 application fields. Some inset figures are reproduced from ref.[31] (Copyright 2021, ACS Publications), ref.[48] (Copyright 2020, Wiley-VCH), ref.[78] (Copyright 2025, Wiley-VCH), ref.[79] (Copyright 2024, Wiley-VCH), ref.[86] (Copyright 2023, RSC Publishing), ref.[87] (Copyright 2024, Springer Nature), ref.[93] (Copyright 2023, Elsevier), ref.[95] (Copyright 2024, Wiley-VCH) |
2. Reaction mechanism of electrocatalytic ORR for H2O2 production
2.1 Reaction mechanism
ORR involves multiple elementary steps, including O2 adsorption, electron/proton transfer, and formation of oxygen-containing intermediates.[39,40] ORR is typically categorized into two pathways: the four-electron (4e⁻) pathway and the two-electron (2e⁻) pathway. Among them, the 4e⁻ pathway, which produces H2O, serves as the core cathode reaction in metal-air batteries, whereas the 2e⁻ pathway is employed for the electrocatalytic synthesis of H2O2. The corresponding reaction equations of ORR in various media are listed below: [41]
Acidic/Neutral:O2+4H++4e-→2H2O(4e-)
O2+2H++2e-→H2O2(2e-)
Alkaline:O2+2H2O+4e-→4OH-(4e-)
O2+H2O+2e-→HO2-+OH-(2e-)
As shown in Figure 4a, the ORR process typically initiates with O2 adsorption on the catalyst surface. Active sites bind O2 in a specific configuration, while electrons transfer from the electrode surface to the active sites, thereby triggering subsequent processes such as bond cleavage, proton/electron transfer, and chemical reconstruction. Finally, the products desorb from the active sites and the electrode-electrolyte interface.[43,44] Specifically, O2 adsorbed on the electrode surface first combines with a proton (H+) and an electron (e⁻) to form the *OOH intermediate. If the O-O bond of *OOH cleaves and further dissociates into *O and *OH, the ORR proceeds via the 4e⁻ pathway to produce H2O. In contrast, if the O-O bond of *OOH remains intact and combines with an additional H⁺ and e⁻, the 2e⁻ pathway dominates, generating H2O2.[45-47]
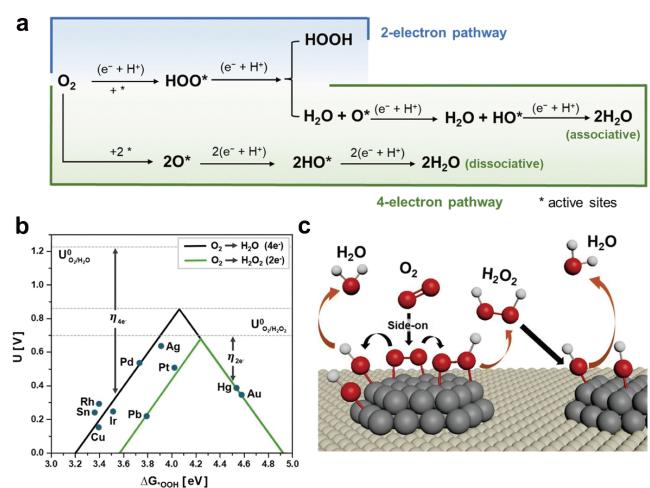
Figure 4. Reaction mechanism of electrocatalytic ORR for H2O2 production. (a) 4e⁻ and 2e⁻ reaction pathways, (b) Sabatier volcano plot of ORR on pure metal catalysts. (c) Schematic diagram of changes in the oxygen adsorption model of pure metals. Gray atoms represent active metals, and beige atoms represent carbon substrates.[42] (Copyright 2024, Royal Society of Chemistry) |
Notably, the 4e⁻ ORR exhibits a more positive electrode potential and higher energy conversion efficiency, making it thermodynamically favored over the 2e⁻ pathway.[48-50] Thus, suppressing the 4e⁻ pathway and promoting the 2e⁻ pathway is critical for efficient H2O2 synthesis. From the mechanism outlined above, the 2e⁻ ORR process hinges on the formation and stabilization of the *OOH intermediate: cleavage of the O−O bond diverts the reaction to the 4e⁻ pathway, while retention of the O−O bond is a prerequisite for H2O2 generation [51,52]. Additionally, the binding strength between the *OOH intermediate and the catalyst surface plays a decisive role in determining the reaction pathway.[53,54]
Figure 4b presents a Sabatier volcano plot illustrating the correlation between ORR potential and *OOH binding energy for different metals. Metals located on the left side of the volcano peak exhibit excessively strong *OOH adsorption, leading to prolonged residence of *OOH on the catalyst surface. This facilitates O-O bond dissociation into *OH and *O, favoring the 4e⁻ ORR pathway. Conversely, metals on the right side of the peak display weak *OOH adsorption, which slows the initial combination of O2 molecules with H+, reducing the activity of 2e⁻ ORR for H2O2 synthesis.[55,56] These findings underscore that for the 2e⁻ ORR, both retention of the O-O bond and moderate *OOH adsorption energy are critical for efficient electrocatalytic H2O2 production. Therefore, controlling the catalyst’s geometric structure and active site distribution is essential to facilitate end-on adsorption of *OOH (Figure 4c), inhibit O-O bond cleavage, and promote the 2e⁻ pathway. This ultimately ensuring high H2O2 activity and selectivity.
2.2 Local reaction environment and reaction kinetics
In acidic media, the high proton (H⁺) concentration accelerates the proton-coupled electron transfer (PCET) process of the *OOH intermediate. Meanwhile, the high ionic strength compresses the electric double layer (EDL) near the catalyst surface, thereby enhancing the electrostatic interaction between the catalyst surface and the *OOH intermediate. Additionally, the ordered hydrogen bond network formed by interfacial water molecules improves proton transfer efficiency, but it may also compete with the *OOH intermediate for adsorption sites on the catalyst surface. In alkaline media, the high concentration of hydroxide ions (OH⁻) modulates the protonation degree of the *OOH intermediate. The expanded EDL near the catalyst surface weakens the electrostatic interaction between the catalyst surface and the *OOH intermediate. Moreover, the disordered structure of interfacial water inhibits proton transfer, while effectively suppressing the non-selective decomposition of H2O2 (a common side reaction in acidic media).
The dynamic local pH near the catalyst surface, different from the bulk electrolyte pH, can regulate the reaction free energy barrier and further affects the catalytic performance by modulating the adsorption energy of the *OOH intermediate. For example, during the electrosynthesis of H2O2 in acidic media, an enhanced local alkaline microenvironment forms on the surface of F-doped carbon nanotubes (F-CNTs), significantly lowering the energy barrier for *OOH formation and improving oxygen transfer. Their synergistic effect boosts the selectivity toward H2O2 in acidic conditions.[57]
3. Synthesis and characterization
Figure 5 summarizes the commonly used synthesis methods and characterization techniques for electrocatalytic H2O2 production. In catalyst preparation, the choice of synthetic approach is closely related to the specific demands of electrocatalytic H2O2 generation. Such catalysts are required to favor the 2e⁻ ORR pathway and enable precise regulation of active sites and electronic structures. [58]
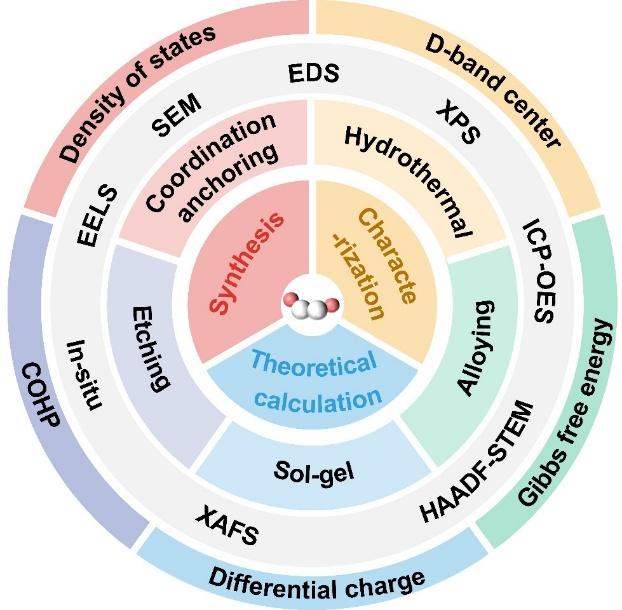
Figure 5. Main research methods for electrocatalytic 2e- reduction to produce H2O2. |
3.1 Synthesis methods
Catalysts for electrocatalytic H2O2 production can be prepared via various strategies, including the hydrothermal method, coordination anchoring method, alloying method[8], etching method[31], sol-gel method[27], and defect engineering method. These methods are all centered around optimizing catalyst performance and achieve targeted regulation from dimensions such as morphology, active sites, and electronic structure.
Each approach exhibits distinct merits and inherent trade-offs. The hydrothermal method enables controllable crystal growth and uniform morphology under mild conditions, yet suffers from relatively low scalability, long reaction times, and limited batch-to-batch reproducibility. The coordination anchoring method achieves highly dispersed metal sites (especially for SAC) and strong metal-support interactions, but relies on elaborate ligand design and precise thermal control, which complicates large-scale preparation. Alloying method effectively modulates d-band centers and optimizes intermediate adsorption, improving both activity and selectivity. However, it often requires high-temperature treatment and precise elemental ratio control, potentially causing particle sintering and phase segregation. The etching method creates rich pores and surface defects to expose more active sites, but may cause structural collapse, excessive surface roughness, or reduced electrical conductivity. The sol-gel method provides homogeneous elemental mixing and tunable porosity at low temperatures, but involves slow gelation, high calcination temperatures, and possible shrinkage-induced structural damage. Finally, defect engineering method significantly enhances intrinsic activity by regulating charge distribution and intermediate binding, yet excessive defects can accelerate carbon corrosion, induce structural instability, and degrade long-term stability.
3.2 Characterization methods
At the characterization level, techniques such as Scanning Electron Microscopy (SEM) and High-Angle Annular Dark-Field Scanning Transmission Electron Microscopy (HAADF-STEM) are used to observe the microscopic morphology and dispersibility of the catalyst. X-ray Photoelectron Spectroscopy (XPS) and X-ray Absorption Fine Structure (XAFS) can analyze the chemical valence state and coordination environment of the active sites.[59,60]
Under practical ORR operating conditions, most 2e⁻ ORR catalysts undergo dynamic structural reconstruction, manifested as changes in the coordination environment and surface chemical state of active sites, and even the formation of new active phases, which directly determines catalytic performance. Studies have shown that the actual active sites are mostly reconstructed species rather than the pristine structure. The main reconstruction pathways include the evolution of single-atom catalysts from M-Nx to M-NxOy, surface redox reactions and the formation of oxygen vacancies or oxide layers in metal oxides/chalcogenides, and surface segregation in noble-metal alloys; these processes significantly affect H2O2 selectivity by tuning the *OOH adsorption energy.
Operando X-ray absorption spectroscopy (XAS) can accurately characterize the local coordination environment (coordination number, bond length) and valence state of metal active sites under operating conditions, and track the dynamic evolution of M-N/O bonds in single-atom catalysts and the oxidation state changes of precious metal active sites. In-situ attenuated total reflection surface-enhanced infrared absorption spectroscopy (ATR-SEIRAS) serves as a powerful tool to identify the degradation pathways of catalysts during long-term 2e⁻ ORR operation by dynamically tracking surface intermediates, functional groups, and structural evolution under realistic working conditions. It enables real-time detection of adsorbed *OOH, *OH, and H2O2 species, whose accumulation or abnormal transformation indicates excessive intermediate adsorption, non-selective decomposition, or the generation of reactive oxygen species (ROS) that induce carbon oxidation and active site damage. Additionally, in situ Raman spectroscopy is sensitive to the structural changes of carbon supports (e.g., carbon skeleton oxidation, defect generation) and the formation of oxygen-containing functional groups, and can also detect the dynamic changes of *OOH intermediates and catalyst surface oxides during ORR. Furthermore, Mössbauer spectroscopy is especially suitable for the characterization of Fe-based catalysts, which can distinguish the different valence states and coordination environments of Fe active sites under operating conditions, and reveal the reconstruction of Fe-N-C single-atom catalysts.[61,62]
The combination of multiple in situ/operando characterization techniques can realize the multi-dimensional and multi-scale characterization of catalyst reconstruction, which is of great significance for accurately identifying the real active sites of 2e⁻ ORR and revealing the intrinsic catalytic mechanism.
3.3 Theoretical calculation
In the context of theoretical calculations, the application of density functional theory (DFT) is particularly critical. By calculating key parameters including the d-band center, reaction energy barrier, density of states of active sites, differential charge density, and Crystal Orbital Hamilton Population (COHP), the favorable conditions for the 2e⁻ ORR pathway can be elucidated at the atomic scale. This not only provides guidance for the experimental optimization of catalyst structures but also ultimately enables the dual enhancement of efficiency and selectivity in electrocatalytic H2O2 production.[63,64]
DFT calculations can predict the adsorption energy of key intermediates (e.g., *OOH), reaction free energy barriers, and the intrinsic activity of each candidate site. Correlating operando structural information with DFT-derived activity descriptors allows quantitative assignment of the catalytic contribution of each site, exclusion of non-active or spectator species, and clarification of whether the observed performance originates from the as-prepared structure or the dynamically reconstructed phase. This integrated strategy eliminates ambiguity in active-site identification and enables the establishment of a definitive, operationally relevant structure-activity relationship.[65]
4. Yield calculation and performance evaluation criteria for H2O2 electrosynthesis
4.1 Yield calculation methods
4.1.1 H2O2 yield
It is usually expressed as the amount of H2O2 produced per unit mass of catalyst per unit time (mol gcat.−1 h−1), the calculation formula is as follows:
where n is the amount of generated H2O2, t is the electrolysis time, mcat. is the mass of the loaded catalyst. The concentration of H2O2 is determined via cerium sulfate titration[67].
4.1.2 Faradaic efficiency (FE)
Defined as the ratio of the electric quantity consumed for H2O2 generation to the total electric quantity passed through the electrolysis system, it is a key indicator to reflect the electron utilization efficiency of the 2e⁻ ORR pathway, with the calculation formula:
where V is the volume of electrolyte from the cathodic tank, F is the Faraday constant (96,485 C mol−1), C is the concentration of generated H2O2 from the cathodic tank, and Q is the passed charge during the electrolysis.
4.2 Core performance evaluation indicators
The core performance of electrocatalysts for H2O2 production via the 2e⁻ ORR is comprehensively evaluated by three key indicators, all of which are tested under standardized electrochemical conditions to ensure the comparability and reliability of catalytic performance data across different catalysts. The detailed definitions, testing methods and characterization criteria of each indicator are as follows:
4.2.1 Selectivity for H2O2
As the primary indicator for evaluating 2e⁻ ORR catalytic specificity, it refers to the percentage of oxygen molecules that are reduced to H2O2 via the 2e⁻ pathway relative to the total reduced oxygen molecules (excluding the 4e⁻ ORR pathway producing H2O). It is quantitatively determined by the rotating ring-disk electrode (RRDE) technique, calculated from the measured disk current (total ORR current) and ring current (oxidation current of the generated H2O2 at the ring electrode). The standard test conditions are set as: electrode rotation speed of 1600 rpm, potential scanning range of 0.0 ~ 0.8 V (versus reversible hydrogen electrode, vs. RHE), and the selectivity value is expressed as a percentage (%). The calculation formula is as follows:
where ID and IR stand for disk current and ring current, respectively, and N is the calculated collection efficiency. The calibration procedure for the N value is as follows: LSV curves are collected at different speeds in a N2 saturated mixture of 0.1 M KOH + 10 mM K3[Fe(CN)6]. During the test, Fe(CN)64− was oxidized to Fe(CN)63− by adding a constant potential of 1.2V versus RHE to the ring electrode potential. The corrected N value was 0.36.
4.2.2 Electrocatalytic activity
It reflects the reaction rate and kinetic performance of the catalyst for 2e⁻ ORR-driven H2O2 synthesis, and is characterized by two critical electrochemical parameters, both tested by linear sweep voltammetry (LSV) with a scan rate of 5 mV s⁻¹ in an oxygen-saturated electrolyte:
Onset potential (Eonset): The initial potential where the 2e⁻ ORR reaction occurs, expressed in V (vs. RHE). A more positive onset potential indicates a lower reaction overpotential and better intrinsic catalytic activity of the catalyst.
H2O2 partial current density (jH2O2): The current density dedicated exclusively to H2O2 generation at a specific applied potential, expressed in mA cm−2. A higher partial current density means a faster 2e⁻ ORR reaction rate and higher H2O2 production efficiency per unit electrode area.
4.2.3 Catalytic stability
It is a key indicator for assessing the practical application potential of the catalyst, referring to the ability of the catalyst to maintain high H2O2 selectivity and electrocatalytic activity during long-term continuous electrolysis. It is evaluated by the chronoamperometry (CA) test under a constant applied potential (the potential corresponding to the maximum H2O2 selectivity of the catalyst). The stability is characterized by two parameters: current retention rate (the ratio of the final current to the initial current after electrolysis) and H2O2 selectivity attenuation rate (the percentage of selectivity reduction after electrolysis). An excellent catalyst shows a current retention rate of over 80% and a negligible selectivity attenuation (≤5%) after long-term testing, without obvious active site loss or catalyst structure degradation.
5. Electrocatalysts for the synthesis of H2O2 via 2e-ORR
Electrocatalysts serve as the foundation for 2e⁻ ORR-mediated H2O2 synthesis. An ideal 2e⁻ ORR catalyst should exhibit characteristics such as high ORR activity, excellent electrical conductivity, fast mass transfer rate, and low economic cost.[68,69] Additionally, it needs to possess high 2e⁻ ORR selectivity and catalytic stability to ensure continuous, efficient H2O2 production, thereby ensuring that the catalyst can produce H2O2 efficiently and stably. Currently, typical 2e⁻ ORR catalysts mainly encompass precious metal catalysts, carbon-based catalysts, metal oxide catalysts, and SACs.[70,71] A performance comparison of different catalysts in recent years is summarized in Table 1.
Table 1. Performance comparison of various catalysts in recent years. |
| Samples | Onset potential (V vs. RHE) | H2O2 selectivity (%) | H2O2 Yield (mol gcat.−1 h−1) | Stability (h) | References |
|---|---|---|---|---|---|
| ppy-ZnN3 | ~0.78 | 92 | 43 | 48 (-0.38 V vs RHE) | Angew. Chem. Int. Ed. 2025, 64, e202421864. |
| TPDA-BDA COF | 0.72 | 89.7 | - | 50 (2 mA cm−2) | Angew. Chem. Int. Ed. 2025, 64, e202424720. |
| Se2‒Pt | - | 95 | 4.16 | 400 (250 mA cm−2) | Nat. Commun. 2024, 15, 9346. |
| Pb SA/OSC | ~0.76 | 94 | - | 100 (50 mA cm−2) | Nat. Commun. 2024, 15, 193. |
| FeN3O2 | 0.77 | 95 | 29.6 | 10 (200 mA cm−2) | Nat. Commun. 2024, 15, 10758. |
| Pd/MCS-8 | 0.70 | 95 | 15.77 | 12 (0.3 V vs RHE) | Angew. Chem. Int. Ed. 2024, 63, e202403023. |
| Ov-Bi2O3-EO | ~0.65 | 90 | - | 12 (0.4 V vs RHE) | Adv. Mater. 2024, 36, 2408341. |
| CoNCB | 0.76 | ~100 | 4.72 | 5 (20 mA cm−2) | Nat. Commun. 2024, 15, 4079. |
| P-NMG-10 | 0.78 | 91 | 30 | 24 (~40 mA cm−2) | Nat. Commun. 2023, 14, 4430. |
| FS-CFs | 0.814 | 99.1 | - | - | Adv. Mater. 2023, 36, 2208533. |
| CBNO | 0.67 | 95 | 2.89 | 24 (100 mA cm−2) | Angew. Chem. Int. Ed. 2024, 63, e202317267. |
| ZnO@ZnO2 | 0.46 | ~100 | 5.47 | 40 (0.3 V vs RHE) | Energy Environ. Sci. 2023, 16, 3526 |
| .NiOx-C | 0.69 | 90.7 | - | - | ACS Catal. 2022, 12, 5911. |
5.1. Precious metal catalysts
Certain precious metal materials exhibit good catalytic activity and H2O2 selectivity in the 2e⁻ ORR process, making them among the most extensively studied catalytic materials at present. In recent years, there have been many research reports on exploring the 2e⁻ ORR performance of precious metals such as platinum (Pt), palladium (Pd), and gold (Au). Typically, various strategies are employed, including regulating the surface structure of materials and introducing a second metal for alloying, to improve their yield.
To address key challenges in the 2e⁻ ORR for H2O2 electrosynthesis, Siahrostami et al.[8] designed a PtHg4 electrocatalyst for the 2e⁻ ORR. The *OOH binding energy of PtHg4 was near the volcano peak, with an overpotential lower than 0.1 V, and its H2O2 selectivity reached 95% in the potential range of 0.35~0.55 V, outperforming Au/C catalysts in both activity and selectivity. To achieve tunability in the adsorption of oxygen-containing species on the catalyst surface, Jing and colleagues[50] immobilized palladium nanoparticles (Pd NPs) on a carbon substrate with customizable surface properties, preparing Pd/MCS-8 by supporting Pd NPs on mesoporous carbon spheres. The mesoporous structure of the carbon support facilitated O2 enrichment and increased local pH, constructing a favorable reaction microenvironment for the 2e⁻ ORR. The interaction between Pd NPs and the carbon support optimizes the adsorption energy of the reaction intermediate *OOH at the edges of carbon active sites, thereby enabling efficient H2O2 electrosynthesis (Figure 6a and b).
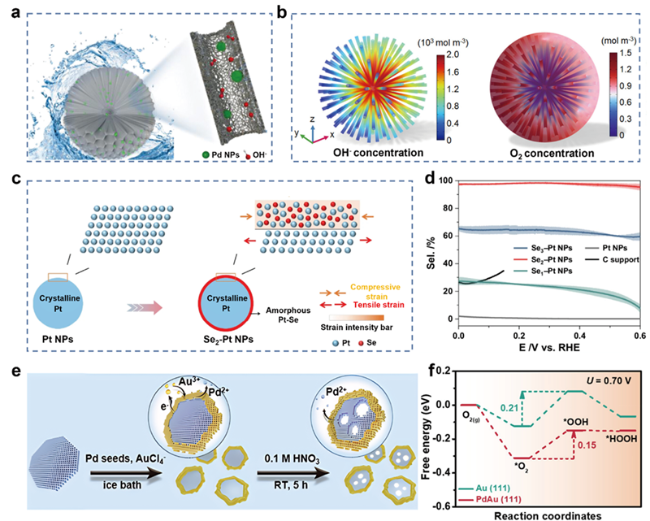
Figure 6. Research on some precious metal materials. (a) Schematic diagram showing the advantages of Pd/MCS-8 in efficient 2e⁻ ORR. (b) Spatial distribution of OH- and O2 concentration.[50] (Copyright 2024, Wiley-VCH) (c) Schematic diagram of the synthesis process of Se2⁻-Pt nanoparticles and the corresponding structural evolution of the surface. (d) Selectivity values (%) calculated from rotating ring-disk electrode (RRDE) polarization curves.[51] (Copyright 2024, Springer Nature) (e) Schematic diagram of the preparation of palladium-gold nanoframes through stepwise growth and etching in solution. (f) Free energy changes during the 2e⁻ ORR to generate H2O2 on Au(111) and PdAu(111) surfaces at a potential of 0.7 V.[31] (Copyright 2021, American Chemical Society) |
As for the need for optimizing *OOH adsorption energy, enhancing H2O2 selectivity, and accelerating reaction kinetics in the 2e⁻ ORR, Yu’s research team[51] prepared Se2-Pt nanoparticles by constructing a Pt-Se shell on the surface of Pt crystal nuclei. The amorphous Pt-Se shell exhibits a moderate O2 adsorption capacity, which can form stress to improve the *OOH adsorption energy, enhance H2O2 selectivity, and accelerate reaction kinetics. After optimizing the shell thickness, the selectivity of electrocatalytic synthesis of H2O2 reached 95% (Fig. 6c and d). Meanwhile, outperforming pure Au catalysts, Zhao and co-workers[31] prepared bimetallic PdAu nanoframes (PdAu-nf) through a series of processes, including CO reduction, low-temperature displacement, and acid etching, and studied their 2e⁻ ORR performance. PdAu-nf has more stable adsorption for *OOH, with H2O2 selectivity greater than 90% in the potential range of 0~0.5 V, which is better than that of pure Au catalysts (Figure 6e and f).
The scarcity and high cost of precious metals remain key barriers to their large-scale application. The crustal abundance of noble metals such as Pt and P is only on the order of 10-9 to 10-8, and the cost of purification and preparation is high, making it difficult to meet the demand for catalyst dosage in industrial-scale H2O2 production. In addition, some precious metal catalysts (such as pure Pt) are prone to dissolution or agglomeration during long-term electrolysis, leading to the loss of active sites, which further limits their practical application scenarios. To address this, researchers are turning to non-noble metal catalysts.
5.2 Carbon-based catalysts
Carbon materials offer low cost, abundant reserves, tunable morphology, high surface area, and good conductivity.[73] However, they face challenges such as low ORR activity and low H2O2 selectivity. In recent years, aiming to optimize the electrocatalytic H2O2 production process with carbon-based materials as catalysts, research efforts have primarily focused on developing regulatory strategies including structural engineering, defect engineering, heteroatom doping, surface functionalization, or the synergistic coupling of multiple strategies to enhance the catalytic activity and H2O2 selectivity of carbon-based catalysts.[74-75]
To tackle the need for providing more ORR reaction environments for pyrrole nitrogen and reducing the reaction energy barrier of the 2e⁻ ORR, Peng et al.[76] designed a pyrrole-nitrogen-rich doped graphene mesoporous carbon composite (P-NMG-10) by constructing pore structures and defect sites. The defects provide more ORR reaction environments for pyrrole nitrogen, reduce the energy barrier of the 2e- ORR reaction, and the selectivity for H2O2 reaches 90% (Figure 7a and b). Researchers led by Xiang[77] prepared fluorine (F) and sulfur (S) co-doped metal-free carbon fiber catalysts (FS-CFs) via electrospinning and pyrolysis. The co-doping of F and S enhances charge transfer and electron spin redistribution, and the adjacent F and S atoms also change the electronic structure of carbon active sites, thereby enhancing the adsorption of *OOH on the active sites and improving the reaction activity and selectivity. FS-CFs exhibited a high onset potential of 0.814 V, with H2O2 selectivity exceeding 85% in the potential range of 0.5-0.8 V, and the yield and FE were 29.3 mol gcat.-1 h-1 and 98.01%, respectively, outperforming most reported carbon-based or metal-based electrocatalysts (Figure 7c-e).
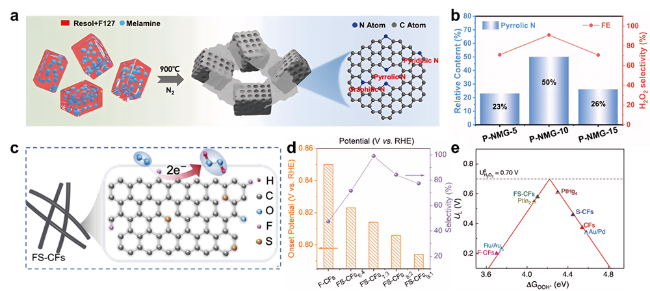
Figure 7. Research on some carbon-based catalytic materials. (a) Schematic diagram of the synthesis of P-NMG-X series materials, (b) Relationship between pyrrole N content and H2O2 selectivity.[76] (Copyright 2023, Springer Nature) (c) Schematic diagram of FS-CFs structure, (d) Onset potentials and selectivities of FS-CFs and comparative samples. (e) Theoretical electrocatalytic activity volcano plot for varied F/S doping configurations.[77] (Copyright 2023, Wiley-VCH) |
Due to the issues of strong *OOH interaction with planar B4C sites, insufficient O2 accumulation, and unwanted HER side reactions in 2e⁻ ORR, Choi and colleagues[78] developed a mesoporous B-doped carbon catalyst (meso-BPC) featuring curved B4C sites by adding a pore-forming agent. In contrast to the planar B4C structure, the curved B4C sites formed in the porous carbon exhibit a weaker interaction with *OOH. Moreover, its porous structure facilitates the accumulation of more O2 and mitigates the HER side reaction. The H2O2 selectivity of B4C reached 88%, with a yield and FE of 119.32 mg h-1 cm-2 and 88%, respectively (Figure 8a and b). To overcome challenges related to the difficult generation and stabilization of *OOH intermediates, Song’s group[79] developed a novel carboxylated h-BN/G heterojunction (CBNO) by adopting a strategy combining boron (B) and nitrogen (N) co-doping with surface carboxyl functionalization. The carboxylated h-BN/G configuration effectively retains a large number of O-O bonds, which is beneficial to the generation and stabilization of *OOH intermediates. At the same time, it can lower the reaction energy barriers of the *OOH→*HOOH and *HOOH→H2O2 processes, thereby improving the 2e⁻ ORR catalytic performance and promoting the generation of H2O2 (Figure 8c and d).
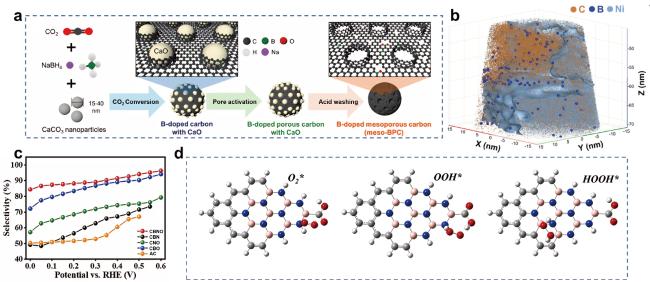
Figure 8. Research on some carbon-based catalytic materials. (a) Schematic diagram of the synthesis process and atomic structure of mesoporous boron phosphide carbon (meso-BPC). (b) Three-dimensional atomic map reconstructed by atomic probe tomography (APT) measurement.[78] (Copyright 2025, Wiley-VCH) (c) H2O2 selectivity of different samples. (d) Adsorption configurations of different oxygen species in CBNO.[79] (Copyright 2023, Wiley-VCH) |
Currently, carbon-based catalysts still exhibit some limitations: some metal-free doped carbon materials are improved through complex hierarchical pore structure design; at the same time, under strong alkaline or long-term electrolysis conditions, the oxygen-containing functional groups on the surface of the carbon skeleton are prone to desorption, resulting in the loss of active sites.
5.3 Metal oxide catalysts
Metal oxide are gaining attention for their abundance, low cost, stability, and tunable coordination.[80-82] Meanwhile, their unique electronic structures and adjustable coordination environments are also conducive to systematically studying their reaction mechanisms and structure-activity relationships.[83,84] Currently, the active sites of metal oxide are mainly adjusted and optimized through design strategies such as morphology, crystal texture structure, and micro-topological structure, thereby improving their activity and selectivity in the 2e- ORR.[85]
Focusing on the issues of unwanted 4e⁻ ORR inhibition of pure In2O3, Wu et al [27] developed a variety of In2O3/CDs-based catalysts that employed carbon dots (CDs) as cocatalysts. The primary active sites are concentrated on In2O3, while CDs can modulate the interfacial electron transfer kinetics and slow down the process. This ensures that insufficient electrons are delivered to O2 molecules, inhibiting the 4e⁻ ORR. Among them, In2O3/CDs-10 achieved nearly 100% H2O2 selectivity, which was much higher than 72% of In2O3, and its H2O2 yield was 4.5 mol gcat. -1 h-1, which was better than that reported in the literature. As for challenges including limited active sites for 2e⁻ ORR and excessively strong binding energies of *OOH and *O intermediates, Zhou’s team [86] designed a ZnO@ZnO2 electrocatalyst. Where the in-situ growth of octahedral ZnO2 on tetrahedral ZnO forms a heterointerface, providing active sites for 2e⁻ ORR. It also weakens the binding energy of *OOH and *O intermediates, thereby promoting excellent 2e⁻ ORR activity with a selectivity of 97.75~100%. At 0.1 V, the yield and FE were 5.47 mol gcat.-1 h-1 and 95.5%, respectively (Figure 9a and b).
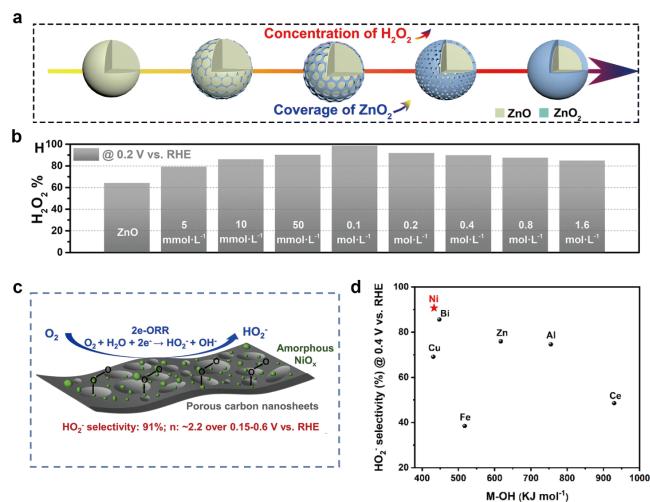
Figure 9. Research on some metal oxide catalytic materials. (a) Schematic diagram of the coverage of ZnO2 on ZnO as a function of H2O2 concentration. (b) H2O2 selectivity of ZnO treated with different concentrations of H2O2.[86] (Copyright 2023, RSC Publishing) (c) Schematic diagram of NiOx catalytic process. (d) Relationship between M-OH bond strength and H2O2 selectivity.[87] (Copyright 2022, American Chemical Society) |
In Wu’s work, [87] by regulating the crystallinity of the metal oxide and the pore structure of the carbon support, it was found that amorphous NiOx and moderate Ni-OH bond strength can make the *OOH intermediate tend to be adsorbed on amorphous NiOx-C through the end-on mode, while the mesoporous structure of the carbon nanosheets can promote O2 adsorption and improve the H2O2 selectivity (maximum 91% within 0.15~0.60 V), with performance superior to crystalline materials (Figure 9c and d).
However, metal oxide still suffer from inherent limitations of insufficient conductivity and poor uniformity of active sites: the electronic conductivity of most metal oxides is only 10-4~10-2 S・cm-1, and they need to be compounded with carbon materials to meet the requirements of electron transport; at the same time, traditional preparation processes easily lead to agglomeration of active sites or uneven distribution of vacancies, affecting the precise regulation of *OOH adsorption energy.
5.4 Single-atom catalysts
SACs feature atomically dispersed active sites, offering high metal utilization and uniform active centers. Moreover, the electronic structure and coordination environment of the metal centers are highly tunable, which is more conducive to the top adsorption of O2 molecules and tends to the 2e⁻ ORR path. They are a type of promising catalytic material for the electrochemical synthesis of H2O2.[88-91]
To reduce chemical/electrochemical decomposition during H2O2 electrochemical synthesis, Du’s research team[91] prepared a carbon black-supported Co-N-C SACs (CB@Co-N-C) and weakened the chemical/ electrochemical decomposition by adjusting the catalytic layer thickness, thereby improving the 2e⁻ ORR selectivity. In addition to selecting appropriate central metal atoms, the coordination environment also plays a crucial role in determining reaction selectivity. Chen et al.[92] designed a series of Zn-N4 SACs with pyrrole/pyridine nitrogen (NPo/NPd) synergistic coordination through temperature control. They found that reasonable adjustment of the coordination of NPo/NPd in the Zn-N4 configuration can achieve a *OOH adsorption strength close to the optimal value, achieving a performance superior to that of configurations with a single N species. Among them, the H2O2 selectivity of ZnNC-700 can reach up to 97%, and the maximum yield and FE reached 11.2 mol gcat.-1 h-1 and 90% respectively (Figure 10a-c). Additionally, to regulate the eccentricity distance of Co atoms and enhance the adsorption energy of *OOH intermediates, Liu and colleagues [93] reported an atomically dispersed asymmetric cobalt catalyst (CoNCB). Compared with the square symmetric Co-N4 configuration, the asymmetric Co-C/N/O configuration regulates the eccentricity distance of Co atoms and enhances the adsorption energy of *OOH intermediates. The selectivity reached 95% in the potential range of 0.45~0.75 V, with the yield and FE being 4.72 mol gcat.-1 h-1 and 60% respectively (Figure 10d).
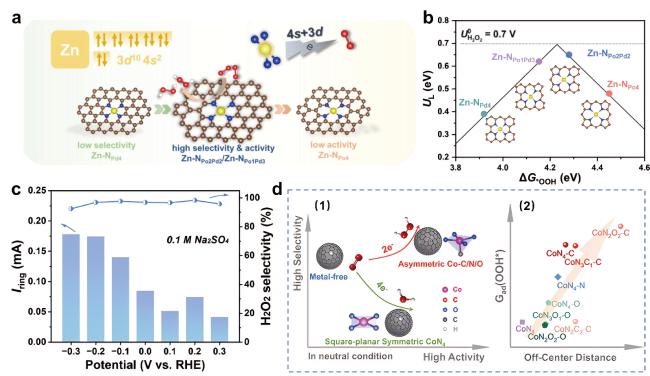
Figure 10. Research on some single-atom catalytic materials. (a) Schematic diagram of the mechanism of Zn-N4 SACs with different NPo/NPd coordination environments. (b) Calculated catalytic activity volcano plot for H2O2 production via 2e-ORR pathway. (c) Ring current obtained by linear sweep voltammetry (LSV) on a rotating ring-disk electrode (RRDE) in oxygen-saturated 0.1 M sodium sulfate solution, and the corresponding H2O2 selectivity of ZnNC-700.[92] (Copyright 2024, Elsevier) (d) Schematic diagram of EHPP selectivity and activity of centrally symmetric CoN4 and asymmetric Co-C/N/O electrocatalysts in 0.1 M PBS (pH=7) (1); relationship between the eccentricity distance of Co atoms and the adsorption energy of *OOH (2).[93] (Copyright 2024, Springer Nature) |
Focusing on a typical Co-N-C SACs, Chen and researchers [94] investigated a typical Co-N-C SACs catalyst and obtained CoN4-B3C by introducing B atoms into the second coordination layer. B is doped at the B3 position of the second coordination layer, which modifies the catalytic atomic interface, enhances the proton affinity on the catalyst surface, promotes the combination of *O at the front end of *OOH with protons, and this favors the 2e⁻ ORR pathway (Figure 11a and b). Inspired by natural enzymes containing Mn, Zeng’s group[95] prepared an N, O co-coordinated Mn SACs catalyst (Mn CD/C) on a carbon dot carrier. The maximum H2O2 selectivity of Mn CD/C reached 95.8%, with the yield and FE being 8.68 mol gcat.-1 h-1 and 80% respectively (Figure 11c-e).
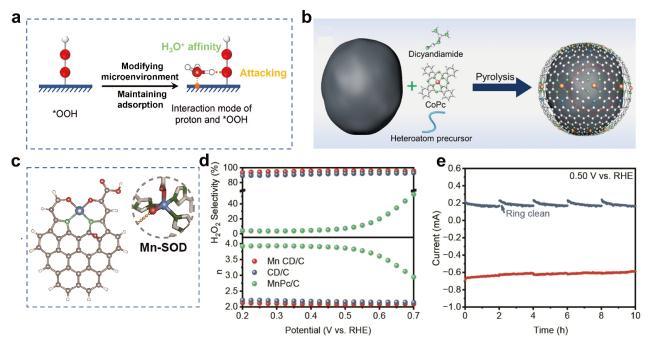
Figure 11. Research on some single-atom catalytic materials. (a) Research strategy of Co1-NBC (b) Schematic diagram of the typical preparation process of heteroatom-doped cobalt SACs.[94] (Copyright 2024, Wiley-VCH) (c) Schematic diagram of Mn CD synthesis. (d) Chronoamperometry test of Mn CD/C at 0.50 V. (e) H2O2 selectivity and electron transfer number.[95] (Copyright 2024, Wiley-VCH) |
However, challenges remain for the large-scale synthesis and long-term stability of SACs. On the one hand, single-atom metals (such as Mn, Co) tend to migrate and aggregate during high-temperature preparation or long-term electrolysis, leading to the loss of active sites. On the other hand, the metal loading of most SACs is low (usually < 5 wt%), which is insufficient to meet the demand for a high active site density required for industrial-scale H2O2 production. Moreover, the synthesis is challenging and it is difficult to precisely fabricate the ideal catalyst.
6. Deactivation mechanisms and stability enhancement strategies
6.1 Deactivation mechanisms
Catalytic stability is one of core indicators for evaluating the practical application potential of 2e⁻ ORR catalysts, which is closely related to the service life and industrialization feasibility of electrocatalytic H2O2 production systems. Under long-term ORR operating conditions (acidic/alkaline electrolytes, continuous applied potential, and so on), 2e⁻ ORR catalysts are prone to various degradation pathways, mainly including carbon corrosion, metal leaching, active sites reconstruction and agglomeration and H2O2-induced oxidative degradation.
6.1.1 Carbon corrosion
Carbon-based supports (e.g., porous carbon, graphene, carbon nanotubes) are widely used in 2e⁻ ORR catalysts due to their high conductivity and large specific surface area. However, in the ORR process, the hydroxyl radicals (·OH) generated by the spontaneous decomposition of H2O2 can oxidize the carbon skeleton, leading to the destruction of the carbon support structure, the loss of active site anchoring sites, and the reduction of catalyst conductivity.[96] Carbon corrosion is more severe in acidic electrolytes and at high applied potentials, which is a major degradation pathway for carbon-based and single-atom catalysts with carbon supports.
6.1.2 Metal leaching
In acidic or alkaline electrolytes, metal catalysts (e.g., Pd, Ni, Sn, etc.) may undergo oxidation reactions due to changes in electrode potential, causing metal ions to dissolve from the catalyst surface into the electrolyte. In addition, the coordination structure on the catalyst surface may change during the reaction, weakening the metal-support interaction and making metal atoms more prone to detachment. And under industrial-level current densities, the reaction rate accelerates, and electron transfer and ion diffusion on the metal surface intensify, increasing the risk of metal leaching. Metal leaching directly causes the loss of active sites, resulting in a sharp decline in catalytic activity and selectivity.[97]
6.1.3 Active sites reconstruction and agglomeration
During electrocatalysis, the active sites of metal single-atom catalysts (e.g., Ni, Co, etc.) may undergo irreversible reconstruction with potential variation, such as transformation from atomically dispersed states into metal nanoclusters, resulting in the reduction or loss of active sites and degraded catalytic activity. Moreover, under long-term operation, metal atoms can migrate and agglomerate driven by thermal motion and electrochemical effects, which further deteriorates the overall catalytic performance.[97]
6.1.4 H2O2-induced oxidative degradation
The in-situ generated H2O2 and its decomposition products (·OH, O2⁻) have strong oxidative properties, which can oxidize the surface of metal active sites or modify the electronic structure of catalytic interfaces. For example, the amorphous Pt-Se shell in Se2-Pt nanoparticles can be oxidized by H2O2 to form PtOₓ and SeO42⁻, leading to the destruction of the shell structure and the loss of the regulated *OOH adsorption energy. In addition, the oxygen vacancies in metal oxide catalysts can be occupied by oxygen atoms from H2O2 decomposition, resulting in the reduction of O2 activation capacity.[51]
6.2 Stability enhancement strategies
To mitigate the above degradation pathways and improve the long-term catalytic stability of 2e⁻ ORR catalysts, targeted and actionable strategies are proposed based on recent research advances.
6.2.1 Engineering catalyst design
Strengthen the interaction between metal active sites and supports by optimizing the coordination environment (e.g., introducing second coordination sphere heteroatoms, constructing bimetallic active sites) to inhibit metal leaching. Moreover, construct a protective shell (e.g., inert metal oxides, carbon layers, metal-organic frameworks (MOFs)) on the surface of catalyst active sites to isolate the direct contact between active sites and electrolytes/H2O2. The core-shell structure can effectively address critical issues including low selectivity and poor stability encountered in electrocatalytic H2O2 production by regulating the electronic structure and surface properties of catalysts.[98,99]
Modify the surface of carbon supports with inert materials (e.g., polytetrafluoroethylene (PTFE), boron nitride (BN)) to form a hydrophobic and anti-oxidative coating, which reduces the adsorption of ·OH on the carbon surface and inhibits carbon corrosion. In addition, introducing heteroatoms (e.g., B, F, P) to form cross-linking bonds with the carbon skeleton can enhance the structural stability of the carbon support and prevent the desorption of oxygen-containing functional groups.[100] Meanwhile, hydrophobic/ hydrophilic functionalization of the catalyst surface and the construction of a hydrophobic-hydrophilic gradient structure facilitate oxygen transfer and proton conduction, thereby inhibiting parasitic reactions.[101]
6.2.2 Regulating reaction environment
Reaction environment can be regulated via pH adjustment and electrolyte optimization. Tuning the electrolyte pH creates a local alkaline or acidic microenvironment to suppress side reactions such as the hydrogen evolution reaction and hydrogen peroxide decomposition, thereby enhancing reaction selectivity and stability.[57] Meanwhile, selecting suitable electrolyte components and concentrations (e.g., buffer-containing electrolytes) stabilizes the pH and ionic strength of the reaction system, mitigating electrolyte-induced corrosion or interference toward the catalyst.
6.2.3 System integration and protection
System integration can be achieved through membrane electrode assembly (MEA) and radical scavenging. MEA technology integrates the catalyst layer, electrolyte membrane, and gas diffusion layer to optimize interfacial contact and mass transport, thereby enhancing the overall stability.[101] Meanwhile, radical scavengers can be introduced into the reaction system, or the intrinsic radical-scavenging capability of the catalyst can be utilized to suppress side reactions such as Fenton-like reactions, protecting both the catalyst and the product.
These strategies are often employed in combination, and synergistic optimization is achieved through multiscale engineering (atomic, micro, and macro levels) to realize the efficient and stable operation of electrocatalytic hydrogen peroxide production.
7. On-site H2O2 reactors
7.1 Research progress in on-site H2O2 reactors
Based on the core requirements for the electrochemical synthesis of H2O2 via 2e⁻ ORR, reactor design has evolved around three key objectives: enhancing selectivity, improving mass transfer efficiency, and adapting to industrial-scale applications. It leads to the development of mainstream technical pathways such as flow cells, membrane electrode assembly (MEA) reactors, proton exchange membrane (PEM) reactors, solid-state electrolyte (SSE) reactors, and coupled reactors.
Flow cell reactors enhance mass transfer via electrolyte circulation, making them suitable for medium to high concentration H2O2 production. The reactor is primarily composed of a gas diffusion electrode (GDE) loaded with the catalysts, an electrolyte circulation channel, an oxygen inlet pipeline, a current collector and a sealed reaction chamber. The GDE serves as the cathode to realize direct contact between O2 and the catalytic active sites, eliminating the mass transfer limitation caused by the low solubility of O2 in aqueous electrolytes; the electrolyte circulation channel accelerates the renewal of the reaction interface and the desorption of H2O2 products, while the current collector ensures efficient electron transfer during the electrocatalytic reaction. Inspired by nature, Zeng et al.[95] designed N,O-coordinated Mn sites (Mn CD/C) and assembled a flow cell (Figure 12a). In this configuration, O2 directly contacts Mn CD/C, circumventing the issue of low O2 solubility in aqueous electrolytes.
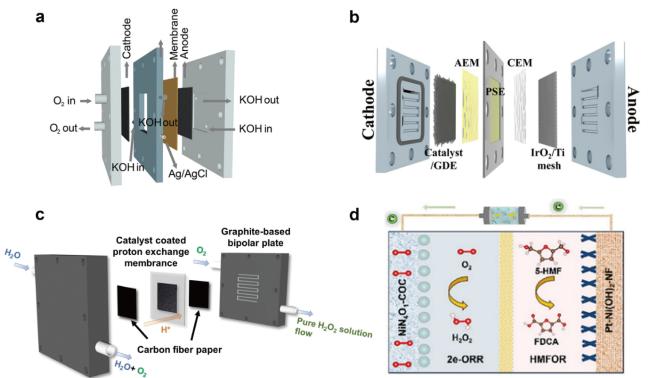
Figure 12. Research on some on site H2O2 reactor. (a) Scheme of the flow cell.[95] (Copyright 2024, Wiley-VCH) (b) Schematic of the assembly of each part of the internal structure.[98] (Copyright 2025, Wiley-VCH) (c) Schematic diagram of the graphite-based PEM electrolyzer for the continuous production of high-concentration H2O2 liquid flow.[102] (Copyright 2024, Wiley-VCH) (d) Schematic diagram of the coupled 2e− ORR || HMFOR system.[103] (Copyright 2025, Wiley-VCH) |
MEA reactors, utilizing flow field design and gas diffusion electrodes, overcome mass transfer limitations and enable high-concentration H2O2 synthesis at high current densities. Nevertheless, catalyst detachment reduces reactivity and stability, and H2O2 decomposition at the membrane interface also lowers the overall yield. SSE reactors incorporate a porous solid-state electrolyte interlayer at the membrane interface to prevent direct contact between the liquid electrolyte and the catalyst, thereby avoiding electrode flooding. By introducing pure water or a carrier gas into the interlayer, adjustable concentrations of high-purity H2O2 solution can be obtained without post-reaction separation or purification, making it suitable for various decentralized applications. Miao and co-workers[98] proposed a strategy involving cation vacancy generation via self-optimizing reconstruction of metal-organic frameworks, achieving efficient H2O2 electrosynthesis at industrial-grade current densities in solid-state electrolyte reactors (Figure 12b). Its core components include a catalyst layer with cation vacancies, a porous solid-state electrolyte interlayer (PSE), an anion exchange membrane (AEM), a cation exchange membrane (CEM), an IrO2/Ti mesh anode and a double-chamber reaction module. The PSE interlayer is the key functional component, which isolates the liquid electrolyte from the cathode catalyst layer to avoid electrode flooding and active site deactivation; the AEM and CEM achieve selective ion transport, and the IrO2/Ti mesh acts as a high-stability anode for the oxygen evolution reaction (OER) to match the cathodic 2e⁻ ORR.
PEM reactors, valued for their high proton conductivity and ease of product separation, are a key research focus for acidic 2e⁻ ORR, with recent advances centered on catalyst-membrane-electrode interface optimization. Chen and colleagues[102] designed a series of cobalt porphyrin-based molecular catalysts supported on reduced graphene oxide (CoTPP@RGO). A PEM electrolyzer using this catalyst at the cathode (with pure water at the anode) continuously produced ~7 wt% pure H2O2 solution for over 200 hours at a low cell voltage of ~2.1 V and a current density of 400 mA cm-2 (Figure 12c). This reactor features a graphite-based bipolar plate, a high-conductivity PEM as the core separator, a CoTPP@RGO modified cathode catalyst layer, a pure water anode chamber, a liquid flow channel and a gas-tight sealing assembly. The graphite bipolar plate undertakes dual functions of current conduction and reaction interface support, and the PEM enables rapid proton transport from the anode to the cathode while preventing the mixing of cathodic and anodic products. The liquid flow channel is designed to realize continuous production and collection of high-concentration H2O2 solution.
Coupled reactors, which integrate the 2e⁻ ORR with other reactions, represent an emerging direction. By replacing the OER with an alternative anodic oxidation reaction, overall energy efficiency is improved. In Nie’s work, [103] a novel Ni-N-C SAC featuring Ni-N4O1 coordination was designed. This SAC successfully realized the coupling of cathodic 2e⁻ ORR and anodic oxidation of 5-hydroxymethylfurfural (5-HMF). At a current density of 50 mA cm-2, the overpotential for 5-HMF oxidation was only 0.32 V, which is considerably lower than that of the conventional OER process (Figure 12d). The integrated reactor consists of a Ni-N4O1 SAC modified cathode, a 5-hydroxymethylfurfural (5-HMF) oxidation anode, a carbon fiber paper current carrier, a proton exchange membrane and a co-electrolysis reaction cell. The cathode is dedicated to the 2e⁻ ORR for H2O2 generation, and the anode replaces the traditional OER with the selective oxidation of 5-HMF to 2,5-furandicarboxylic acid (FDCA); the proton exchange membrane realizes proton balance between the two electrodes, and the carbon fiber paper ensures efficient mass and electron transfer at the electrode-electrolyte interface.
7.2 Design of on-site H2O2 reactors
By rationally tuning porosity, hydrophobicity, and thickness according to reactor type, the three-phase interface can be stabilized, product desorption accelerated, and degradation pathways (such as carbon corrosion and active-site leaching) mitigated, thereby bridging catalyst design and reactor engineering toward practical high-performance H2O2 electrosynthesis.
In flow cells employing GDEs, the catalyst layer must be designed with hierarchical porosity to enable rapid gas-phase O2 diffusion from the backing layer to active sites, while moderate hydrophobicity (typically 90-120° water contact angle) is introduced to prevent electrode flooding and suppress H2O2 accumulation and decomposition. The catalyst layer thickness is usually controlled within 5~20 μm to balance sufficient active-site loading and minimal mass-transport resistance.[104] In contrast, for submerged three-electrode cells, which rely on dissolved O2, the catalyst should possess higher overall porosity and enhanced hydrophilicity to ensure full electrolyte wetting and efficient diffusion of dissolved oxygen; excessive hydrophobicity is avoided because it severely limits O2 availability. The catalyst layer is generally thinner (3~10 μm) to minimize the diffusion distance of dissolved O2 and avoid local O2 depletion.[105]
8. On-site H2O2 applications
H2O2 is an inorganic chemical with strong oxidizing and weak reducing characteristics. At room temperature, it is a colorless, transparent liquid that dissolves easily in water. Its main feature is that the decomposition products are solely water and oxygen, with no secondary pollutants. With the advancement of environmental protection concepts and technological iteration, H2O2, relying on this advantage, has been applied in various fields such as antibacterial disinfection, water treatment, organic matter degradation, and green agricultural production, becoming a key chemical with both practicality and sustainability.[14,67]
8.1 Antibacterial
H2O2 has powerful oxidizing properties. When it comes into contact with bacteria, it rapidly decomposes to produce nascent oxygen (O2) and hydroxyl radicals (·OH). These reactive oxygen species can damage the cell walls and cell membranes of bacteria, as well as internal biological macromolecules such as proteins and nucleic acids, thereby disrupting bacterial metabolism and reproduction and exerting a bactericidal effect. Compared with strategies using antibiotics and metal ions (such as Ag, Cu), H2O2 offers a stronger, broad-spectrum antibacterial effect and a reduced risk of inducing bacterial resistance.
To achieve the continuous production of high-concentration pure H2O2 and full-spectrum antibacterial activity, Zhang et al.[106] designed a nickel phthalocyanine-based COF electrocatalyst (BBL-PcNi). By integrating it into a large electrolytic cell, it can continuously produce a relatively pure H2O2 solution with a concentration of up to 3.5 wt%. Moreover, it exhibited strong antibacterial activity under full-spectrum irradiation (Figure 13a). Addressing the dual-stage needs of “rapid antibacterial action” and “long-term healing promotion” in infected wound treatmen, Huang’s research team [107] developed a CPO-Alg hydrogel (based on calcium peroxide and alginate). Through the dual spatial niche design of CPO NPs (calcium peroxide nanoparticles) within the gel framework, it achieved the biphasic release of H2O2: when used for infected wounds, the weakly constrained CPO NPs release rapidly, and the high concentration of H2O2 can eliminate bacteria and biofilms to exert the initial antibacterial effect, and subsequently can continuously promote the proliferation of healing cells (Figure 13b-d). For synergistically enhancing antibacterial, anti-biofilm, and anti-inflammatory effects, Wu and colleagues[108] synthesized Zn0@ZIF-8 through a simple stirring-physical grinding method, which can in situ generate a large amount of H2O2 through the 2e⁻ ORR. The galvanic corrosion of Zn0 in Zn0@ZIF-8 promotes simultaneous in-situ production of H2O2 and release of Zn2+, thereby enhancing antibacterial, anti-biofilm, and anti-inflammatory effects synergistically.
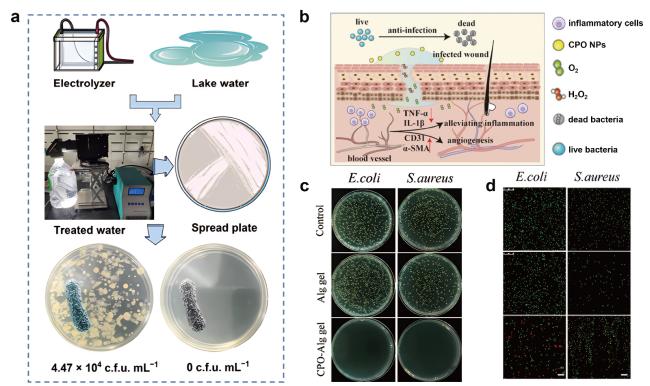
Figure 13. Partial studies on H2O2 disinfection and sterilization. (a) Schematic illustration of the antibacterial properties of the generated solution under full-spectrum irradiation.[106] (Copyright 2024, American Chemical Society) (b) Schematic diagram of their application for infected wound healing. (c) Photographs of bacterial colonies of S. aureus and E. coli on agar plates after different treatments. (d) Fluorescence images of live/dead bacterial staining in different treatment groups. Scale bar: 15 µm.[107] (Copyright 2024, Wiley-VCH) |
8.2 Water treatment
Driven by the need for water pollution control and the assurance of water quality safety, H2O2 has emerged as a key functional reagent in the field of water treatment due to its strong oxidizing properties and no secondary pollution characteristics.
To efficiently achieve electrocatalytic activation of H2O2 and enhance ·OH generation for strong bactericidal performance, Wen and co-workers[109] developed a chainmail catalyst consisting of nitrogen-doped carbon (NC)-encapsulated Co3O4 (NC@Co3O4). Co3O4 withdraws electrons from NC, which strengthens the affinity between oxygen atoms in H2O2 and electron-deficient carbon sites in NC and promotes the cleavage of the O−O bond. As a result, the ·OH generation rate catalyzed by NC@Co3O4 was 6.5 times higher than that of NC alone. When employed as the cathode in a flow-through electrochemical reactor, this system enabled over 6.8-order-of-magnitude (99.99998%) inactivation of Escherichia coli in tap water at an applied voltage of only 2 V (Figure 14a and b).
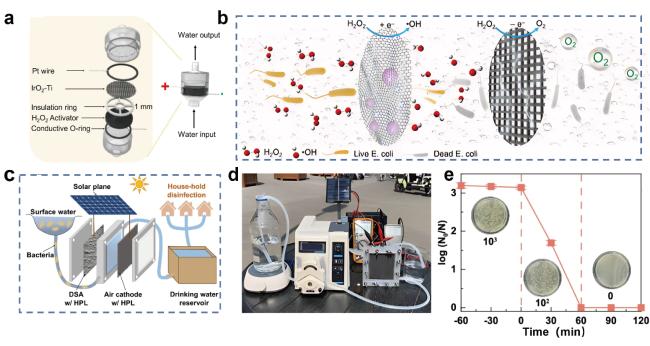
Figure 14. Partial research on H2O2 water treatment. (a) Flow-through reactor for tap water disinfection. (b) Schematic drawing of Escherichia coli inactivation.[109] (Copyright 2023, Elsevier) (c) Schematic illustration and (d) digital image of the solar-driven membrane-free electrolyzer for H2O2 electrosynthesis and disinfection. (e) Surface water sterilization of the solar-driven membrane-free electrolyzer.[110] (Copyright 2025, Springer Nature) |
In addition, to boost H2O2 production and realize efficient surface water disinfection simultaneously, Yi’s group[110] introduced a polytetrafluoroethylene hydrophobic porous layer (HPL) to improve H2O2 generation and combined it with a membrane-free electrolytic cell for surface water disinfection. This configuration achieved complete inactivation of Escherichia coli within 60 minutes (Figure 14c-e).
8.3 Degradation of organic substances
To rapidly synthesize high-density fluorine-containing active sites and obtain materials with excellent 2e⁻ ORR performance for the rapid degradation of common dyes, Peng and colleagues[111] employed plasma ball milling technology to load defect-rich PTFE, with some fluorine atoms removed, onto carbon nanotubes through instantaneous high temperature and ball milling characteristics, thereby achieving the rapid synthesis of high-density fluorine-containing active sites. The developed composite material of defect-rich PTFE with dense fluorine-containing active sites and CNTs exhibited excellent two-electron oxygen reduction performance, enabling the rapid degradation of common dyes such as methylene blue and rhodamine (Figure 15a-c). Li’s group[112] identified molybdenum-doped bismuth tungstate (Bi2WO6:Mo) from a series of bismuth-based oxides. This low-cost, highly selective material is ideal for generating H2O2 through a two-electron water oxidation reaction. It continuously supplies H2O2 for the in-situ degradation of persistent pollutants in aqueous solutions. Li et al.[113] immobilized transition metal manganese (Mn) species onto a porous carbon material (PCM)-based catalyst, yielding the composite catalyst denoted as PCM-DDA-Mn. This PCM-DDA-Mn catalyst not only facilitates the activation of hydrogen peroxide (H2O2) but also enhances the generation of hydroxyl radicals (·OH). These synergistic effects ultimately enabled the efficient degradation of humic acid. (Figure 15d and e)
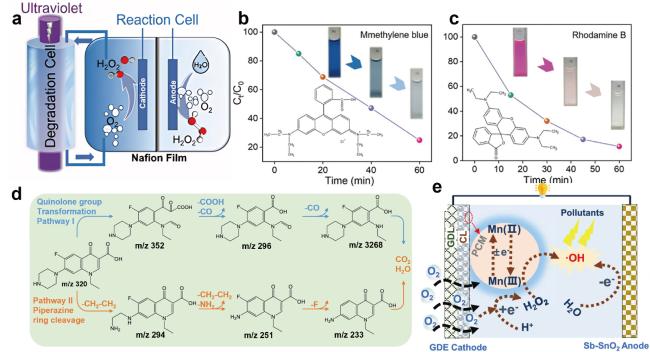


Figure 15. Partial studies on the degradation of organic matter by H2O2. (a) The schematic diagram of the dye and antibiotic degradation device. (b) The degradation effect of methylene blue in the device. (c) The degradation effect of Rhodamine B in the device.[111] (Copyright 2024, Wiley-VCH) (d) Pseudo-first-order rate constant of humic acid removal.[112] (Copyright 2020, Wiley-VCH) (e) The mechanism diagram of pollutant removal.[113] (Copyright 2024, American Chemical Society) |
8.4 Bleaching
H2O2 is a strong oxidizing agent. It can undergo oxidation reactions with pigment molecules, break down the chromophoric groups of the pigments, and make them lose their color. During this reaction, the oxygen element in H2O2 changes from the -1 valence to -2 valence or 0 valence, generating water and oxygen, while oxidizing the pigments into colorless substances. It is often used for bleaching fabrics such as cotton, linen, and polyester-cotton. It can effectively remove natural pigments and impurities, improve the whiteness of fabrics, and cause less damage to fibers. It is also a crucial reagent for pulp bleaching, which is more ecologically friendly than conventional chlorine bleaching and may eliminate colored materials like lignin while enhancing the whiteness and quality of paper.
8.5 Green oxidizing agents
H2O2, as an “environmentally friendly oxidant” can replace toxic/highly polluting oxidants such as potassium permanganate, chromates and fuming sulfuric acid. It is also utilized in the synthesis of numerous chemical raw materials and fine compounds. Nishiguchi and colleagues[114] effectively developed a green process for producing esomeprazole via an asymmetric sulfoxidation reaction utilizing H2O2 as an oxidant in conjunction with iron salts, chiral Schiff bases, and carboxylates.
With continuous breakthroughs in catalyst technology, the application of H2O2 in the field of industrial manufacturing will further expand towards the direction of low energy consumption, high efficiency, and high purity, becoming a key supporting material for the green transformation of industries
9 Challenges and prospects
2e⁻ ORR for H2O2 production currently faces three major core challenges. First, balancing the “activity-selectivity-stability” of the catalyst is difficult: precious metal catalysts (Pt, Pd-based) are costly and prone to dissolution/agglomeration; active sites of carbon-based catalysts are unstable under strong acidic/alkaline conditions; metal oxide exhibit low conductivity (10-4~10-2 S·cm-1); SACs suffer from low metal loading (typically < 5 wt%) and are prone to migration/ agglomeration. Second, large-scale preparation technology is lacking: High-performance catalysts predominantly rely on sophisticated laboratory processes (such as high-temperature calcination for SACs), which involve complex steps, high energy consumption, and are difficult to scale up, and entail high costs. Meanwhile, Kilogram-scale production causes non-uniform heat and mass transfer, leading to inconsistent active-site formation, metal aggregation, and irregular pore structures. Moreover, insufficient mixing and poor temperature control result in low batch-to-batch reproducibility, while metal leaching and structural instability are aggravated at high loading. Collectively, these issues lead to decreased catalytic activity, lower H2O2 selectivity, and poorer stability.[100,115] Third, the adaptability to practical scenarios is insufficient: the laboratory conditions of “three-electrode + pure electrolyte” are disconnected from reality; there is a lack of an integrated scheme of “catalyst-reactor-renewable energy”; and side reactions are likely to occur in complex media (such as high- salt wastewater).
In response to the above challenges, the following prospects for the innovation of future H2O2 preparation technologies are put forward.
(1) Atomic-level precise design of catalysts
It is necessary to precisely regulate the coordination environment of active sites and the electronic structure of catalytic interfaces to break the trade-off among catalytic activity, selectivity, and stability. AI-assisted catalyst design represents an emerging approach to break through the conventional trial-and-error method and accelerate the development of high-performance 2e⁻ ORR catalysts. The core research content includes:[116] (1) Establishing a catalyst structure-performance database by compiling experimental data (e.g., active site structure, catalytic performance, test conditions) and density functional theory (DFT) calculations (e.g., *OOH adsorption energy, reaction energy barrier); (2) Constructing machine learning (ML) models (e.g., random forest, neural network) to correlate catalyst structure with activity/selectivity/ stability, thereby enabling predictive screening of high-performance active sites and catalyst compositions; (3) Integrating ML with DFT calculations to optimize reaction conditions (e.g., electrolyte pH, applied potential) and guide the atomic-level precise design of 2e⁻ ORR catalysts (e.g., tuning active site coordination environments, constructing multicomponent synergistic systems).
In addition, by combining DFT, molecular dynamics and continuum models, the model realistically reproduces the actual reaction microenvironment, deconvolutes the contributions of the EDL, solvent, and interface effects, and establishes quantitative relationships between catalyst structure and performance. This enables reliable, operationally relevant predictions for rational catalyst design beyond idealized static calculations.
(2) System integration of catalysts and reactors and adaptation to decentralized application scenarios
To promote decentralized H2O2 production, efforts should be made to advance the integration of “catalyst-reactor-renewable energy” systems and design miniaturized, portable on-site preparation devices that couple with photovoltaic or wind power. For specific application scenarios such as water treatment and antibacterial disinfection, optimizing reactor structures and immobilizing catalysts on porous electrodes enable the in-situ generation and immediate utilization of H2O2. Additionally, develop efficient methods for the separation and purification of H2O2, such as using solid-state electrolytes and membrane separation technologies, can reduce downstream processing costs and improve product purity.
(3) Cross-scale mechanism analysis and exploration of emerging catalytic systems
Cross-scale mechanistic investigations spanning atomic-level active site behaviors (e.g., *OOH adsorption and desorption) to device-level mass transfer processes (e.g., O2 diffusion and H⁺ transport) are performed to elucidate catalyst deactivation mechanisms and side reaction initiation rules in practical complex electrolytes via in-situ dynamic characterization techniques. While emerging synergistic catalytic systems including photo-electro and enzyme-electro coupling are explored to construct semiconductor-electrocatalyst heterojunctions and bioinspired enzyme-electro hybrid catalysts, further lowering the kinetic barrier of the 2e⁻ ORR to boost the overall efficiency of electrochemical H2O2 synthesis.
(1) Techno-economic analysis (TEA)
The industrialization of electrocatalytic H2O2 production via the 2e⁻ ORR depends not only on the catalytic performance of catalysts but also on economic feasibility. TEA serves as a key tool for evaluating industrialization potential and optimizing production processes. The core TEA contents for electrocatalytic H2O2 production include: (1) calculation of the total production cost; (2) analysis of key cost factors affecting economic feasibility, such as reducing catalyst costs by developing low-cost non-precious metal catalysts and lowering electricity costs by coupling with renewable energy (photovoltaic, wind power); (3) establishment of TEA models for on-site H2O2 production systems and evaluation of the economic competitiveness of the electrocatalytic route compared with the traditional anthraquinone process. Based on TEA results, targeted optimization strategies (e.g., reactor structure optimization) are proposed to reduce production costs and promote the industrialization of electrocatalytic H2O2 production.