

1 Introduction
In the past several decades, the growing levels of CO2 in the atmosphere attributed to the dependence of human activities on fossil fuels have ignited assorted environmental problems such as global warming, ocean acidification and CO2 fertilization[1-4]. Fortunately, photosynthesis in nature provides a great reference for solving this problem. Inspired by this idea, artificial photosynthesis through photocatalytic CO2 conversion, which harnesses solar energy to transform CO2 into a range of valuable solar fuels, has garnered significant attention within the scientific community[5-9]. Amidst the development of the photocatalytic CO2 conversion, a series of potential photocatalysts have been studied such as TiO2, g-C3N4[10], W19O49[11], CdS[12,13] and ZnO. Nevertheless, the photocatalytic CO2 conversion efficiency remains far from practical applications mainly due to the rapid photogenerated charge carrier recombination on photocatalysts[14-17]. Thus, various strategies such as heterojunction construction[18-20], defect engineering[21,22] and cocatalyst loading[23,24] have been employed for enhancing the photocatalytic performance[25].
Heterojunction construction is a common strategy for tuning and optimizing the photogenerated charge carrier separation efficiency of photocatalysts[26-29]. Among various heterojunctions, the coupling of reductive and oxidative semiconductors to form S-scheme heterojunction has been known as one of the most potential heterojunction systems because it can simultaneously enhance the photogenerated charge carrier separation efficiency and optimize the redox capability of the heterojunction system. For example, Yu and co-workers reported that the coupling of WO3 with CN can result in superior photocatalytic performance compared to WO3 and CN counterparts due to the formation of the S-scheme heterojunction[30-34]. Such a unique feature of the S-scheme is attributed to the formation of the internal electric field to guide the accumulation of photogenerated electrons and holes on the reductive and oxidation semiconductors, respectively. Despite the recognized importance of the internal electric field in S-scheme heterojunctions, systematic strategies to modulate this field remain limited and largely underexplored[35,36]. Against this background, the precise tuning of the distribution of vacancies on a semiconductor holds the key to shedding some important light for further optimizing photocatalytic performance through vacancy defect engineering[37,38]. Zheng et al. introduced vacancies to induce defect electronic states within the band gap of BiVO4, thereby increasing the photocatalytic hydrogen production rate to 558 μmol g-1 h-1, clearly demonstrating the importance of vacancies in heterostructure photocatalysis. Ren et al. prepared a new type of Ultrathin porous BWO with abundant surface oxygen vacancies, which can degrade adsorbed tetracycline in situ with a degradation efficiency of about 52.6 times that of bulk BWO[39].
In this study, we first employ a template-directed strategy for the preparation of BWO with surface O vacancies. Subsequently, the obtained OVs-BWO is coupled with CN to construct S-scheme heterojunction photocatalysts for photocatalytic CO2 conversion. It is discovered that the photocatalytic CO2 conversion performance of the CN/OVs-BWO is significantly enhanced compared to the CN, BWO, OVs-BWO and CN/BWO, suggesting the synergistic effect between the oxygen vacancies and S-scheme heterojunction in enhancing the photocatalytic performance. Based on the materials calculation, it is surprisingly discovered that the presence of the oxygen vacancies can significantly reduce the potential barrier of the S-scheme heterojunction, thereby facilitating the photogenerated charge carrier migration across the interface[40-44]. The oxygen vacancy engineering on OVs-BWO not only retains the characteristics of common oxygen vacancies, but also shrinks the potential barrier formed between OVs-BWO and CN. This reduction in potential barrier helps to enhance the migration of charge carriers at the heterojunction interface[45].
2 Experimental
2.1 Materials
Urea, melamine, bismuth nitrate pentahydrate (Bi(NO3)3·5H2O), potassium bromide (KBr), mannitol, polyvinyl pyrrolidone (PVP) and sodium tungstate dihydrate (Na2WO4·2H2O) were purchased from Sinopharm (China). Ethanol (99.99%) was obtained from T·JKEMAO Chemical Reagents Co., Ltd. Deionization water was used throughout the work.
2.2 Preparation of CN
Melamine and urea with a ratio of 1:10 were heated in a tube furnace at 550 °C for 4 h in a nitrogen atmosphere, with a heating rate of 5 °C min−1. The obtained yellow powder was ground to obtain g-C3N4 (CN).
2.3 Preparation of X%CN/BiOBr
40%CN/BiOBr was prepared by hydrothermal method. 0.1 mmol mannitol and 0.047 g KBr were dissolved in 15 mL and 5 mL H2O, respectively. 0.191 g Bi(NO3)3·5H2O, 0.200 g PVP and 0.080 g CN were added to the mannitol aqueous solution with stirring. The KBr aqueous solution was added to the above solution dropwise. After stirring for 1 h, the mixed solution was transferred to a 50 mL autoclave and heated at 160 °C for 3 h. Finally, the mixture was centrifuged and washed with ethanol and DI water, followed by drying at 60 °C to obtain 40%CN/BiOBr. 20%CN/BiOBr, 30%CN/BiOBr, 50%CN/BiOBr and 60%CN/BiOBr were also prepared by changing the content of the CN.
2.4 Preparation of X%CN/OVs-BWO
In a typical procedure, 0.2 g of prepared 40%CN/BiOBr and 80 mL H2O was put into a beaker, 0.13 g Na2WO4·2H2O was added with stirring, and the mixed solution was placed in an oil bath and heated at 90 °C for 24 h. Then the sample was centrifuged and dried, and the same amount of 0.26 g Na2WO4·2H2O was added again and placed in an oil bath at 90 °C for 24 h. Given that the Br− layer can be replaced by the [WO4]2− layer to form a stack of [Bi2O2]2+ and [WO4]2− layers, oxygen defects can be also easily formed during the preparation to obtain 40%CN/OVs-BWO. 20%CN/
OVs-BWO, 30%CN/OVs-BWO, 50%CN/OVs-BWO and 60%CN/OVs-BWO were also prepared by using 20%CN/BiOBr, 30%CN/BiOBr, 50%CN/BiOBr and 60%CN/BiOBr as precursors, respectively.
OVs-BWO, 30%CN/OVs-BWO, 50%CN/OVs-BWO and 60%CN/OVs-BWO were also prepared by using 20%CN/BiOBr, 30%CN/BiOBr, 50%CN/BiOBr and 60%CN/BiOBr as precursors, respectively.
2.5 Measurement of photocatalytic CO2 reduction activity
The photocatalytic performance of the prepared samples was studied using a homemade two-necked flask. A 300 W xenon lamp (λ≥420 nm) was used as simulated sunlight. The light intensity is 7.871 mW/cm2. Prior to the test, 50 mg sample and 10 mL DI water were put into the flask and sonicated for 30 min. Then, the flask was dried in an oven at 60 °C for 6 h, forming a thin film on the bottom of the flask. Then, 0.12 g NaHCO3 was added to the grove on one of the necks of the flask, and the flask was sealed and flow with N2 gas for 30 min. Subsequently, 5 mL H2SO4 (2 mol/L) was added to the grove to react with NaHCO3. Finally, the flask was placed under the xenon lamp for the photocatalytic test. The mixed gas was extracted once every hour and injected into the gas chromatograph (GC-2014C) to analyze the reaction product. The reaction products were detected by a gas chromatograph (GC-2014C) equipped with FID and TCD detectors, where the chromatographic column was RT@-Q-BOND (30 m, 0.53 mm, 20 µm), the detector temperature is 200°C, and the column box temperature is 40°C. The apparent quantum yield (AQE) of CO formation is calculated using the following equation:
$AQE(\%)=\frac{1*M*N_{A}*h*c}{S*P*t*\lambda}* 100\%$
Here, $S$ is the irradiation area, $M$ is the number of CO molecules produced, $P$ is the irradiation intensity, $λ$ is the wavelength of monochromatic light, $t$ is the irradiation time and $N_A$ and $h$ are the Avogadro and Planck constants, respectively.
2.6 In situ EPR characterization
A 300 W xenon lamp was used as the light source for in situ EPR tests. The test was performed using Bruker EPR A300. Before testing, 50 mg sample was added to the paramagnetic tube, and the paramagnetic tube was put into the resonant cavity. Then, the EPR result was obtained under dark conditions. Subsequently, the paramagnetic tube in the resonant cavity was irradiated by the light source and the EPR result was recorded.
2.7 In situ diffuse reflectance infrared Fourier transform spectroscopy
The intermediate products for the photocatalytic CO2 conversion were investigated using in situ diffuse reflectance infrared Fourier transform spectroscopy (DRIFTS) via Thermo Fisher Nicolet iS50 spectrometer. During the test, the sample was placed in a custom-made infrared reaction chamber. A 300 W xenon lamp was used as the light source. Prior to the test, Ar gas was passed through the reaction chamber for 30 min, then CO2 and water vapor were continuously introduced into the chamber. Then, the results were recorded every 10 min under dark conditions. Subsequently, the sample was irradiated by the light source and the results were collected every 5 min. The background of the in-situ DRIFTS results uses the sample itself as the reference.
2.8 Computational details
First-principles density functional theory (DFT) calculations using the CP2K-9.1 package. The system is described using a functional exchange-correlation function of the Perdew-Burke-Ernzerh (PBE) form. Electronic structures in Gaussian and plane wave (GPW) mode frameworks can use unrestricted Kohn-Sham DFT. Goedecker-Teter-Hutter (GTH) pseudopotential and double-ζ molecular optimization basis set (DZVP-MOLOPT-GTH) are embodied in all elements. A plane wave energy cutoff of 400 Ry was used. CN/OVs-BWO has been geometrically optimized using the Broyden-Fletcher-Goldfarb-Shanno (BFGS) algorithm. The force convergence criterion total energy is set to 4.5 * 10-4 bohr/hartree. A vacuum layer 15 Å was constructed to eliminate the interaction between the periodic structures of the surface model. The DFT-D3 method of Grimme corrects for van der Waals (vdW) interactions. In the calculation, the oxygen defects are taken as bridge oxygen atoms, and the defect site is 1.
3 Results and discussion
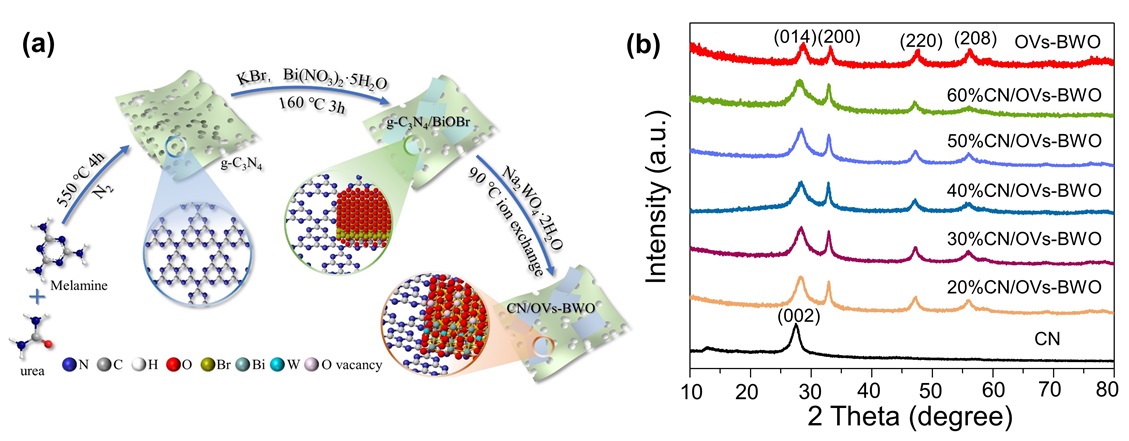
In this work, we aim for optimizing the S-scheme heterojunction by selective oxygen vacancy engineering of the oxide in the composite. Specifically, CN/BWO is prepared using CN/BiOBr as precursors (Figure 1a). The oxygen vacancies are introduced onto the BWO by using the ion exchange method during the formation of the CN/BWO to obtain CN/OVs-BWO. The phase structures of the prepared samples are determined using X-ray diffraction (XRD)[11,46 -50]. As shown in Figure 1b, a broad diffraction peak at approximately 27.41° is observed in the XRD pattern of CN, which corresponds to the (002) crystal plane arising from the periodic stacking of conjugated aromatic layers. For the BWO, four mains diffraction peaks at 28.68°, 33.14°, 47.50° and 56.22° (Figure S1), matching well with the (014), (200), (220), and (208) planes of BWO (JCPDS No. 73-2020), respectively. Compared to the pristine BWO, the OVs-BWO demonstrates weakened and broadened XRD peaks because the presence of oxygen vacancies can reduce the crystallinity of the BWO. All characteristic peaks corresponding to CN and BWO are clearly observed in the XRD patterns of both CN/BWO and CN/OVs-BWO composites, confirming the successful coupling of the two components. Significantly, no adventitious peak is detected in CN/OVs-BWO, indicating that the formation of oxygen vacancies does not introduce any additional impurities.
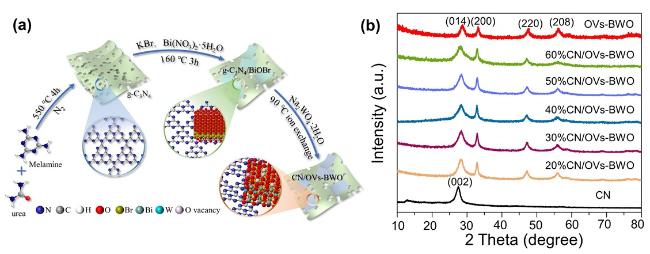
Figure 1. (a) Schematic illustration for the preparation procedure of the CN/OVs-BWO. (b) XRD patterns of the prepared samples. |
Given that CN demonstrates only a peak in XRD characterizations, we also perform the FT-IR characterizations to confirm the presence of CN on the CN/OVs-BWO. As shown in Figure S2, the peak at
810 cm−1 is attributed to the vibrational properties of the tri-s-triazine heterocycles of CN[51-53]. In addition, the peaks at the 1200-1650 cm−1 region are assigned to the different stretching vibration modes of the C-N bond. The N-H stretching of amino groups and O-H stretching of hydroxyl groups appeared in the 3000-3500 cm−1 region. As revealed by the TEM image (Figure 2a), OVs-BWO demonstrates a 2D flake structure (see also SEM image in Figure S3a), which is beneficial for its coupling with the 2D CN (Figure 2b and Figure S3b) to form a 2D-2D structure[54]. For the CN/OVs-BWO, numerous nanoflakes are found to be uniformly distributed on the CN nanosheet (Figure 2c and Figure S3c). Based on the IFFT images, these nanoflakes show an interplanar spacing of 0.329 nm (Figure 2d and e), corresponding to the (351) plane of OVs-BWO. Furthermore, according to the elemental mapping images shown in Figure 2f-k, the Bi, W, C, N, and O elements are homogeneously distributed on the CN/OVs-BWO, suggesting the presence of both CN and BWO.
810 cm−1 is attributed to the vibrational properties of the tri-s-triazine heterocycles of CN[51-53]. In addition, the peaks at the 1200-1650 cm−1 region are assigned to the different stretching vibration modes of the C-N bond. The N-H stretching of amino groups and O-H stretching of hydroxyl groups appeared in the 3000-3500 cm−1 region. As revealed by the TEM image (Figure 2a), OVs-BWO demonstrates a 2D flake structure (see also SEM image in Figure S3a), which is beneficial for its coupling with the 2D CN (Figure 2b and Figure S3b) to form a 2D-2D structure[54]. For the CN/OVs-BWO, numerous nanoflakes are found to be uniformly distributed on the CN nanosheet (Figure 2c and Figure S3c). Based on the IFFT images, these nanoflakes show an interplanar spacing of 0.329 nm (Figure 2d and e), corresponding to the (351) plane of OVs-BWO. Furthermore, according to the elemental mapping images shown in Figure 2f-k, the Bi, W, C, N, and O elements are homogeneously distributed on the CN/OVs-BWO, suggesting the presence of both CN and BWO.
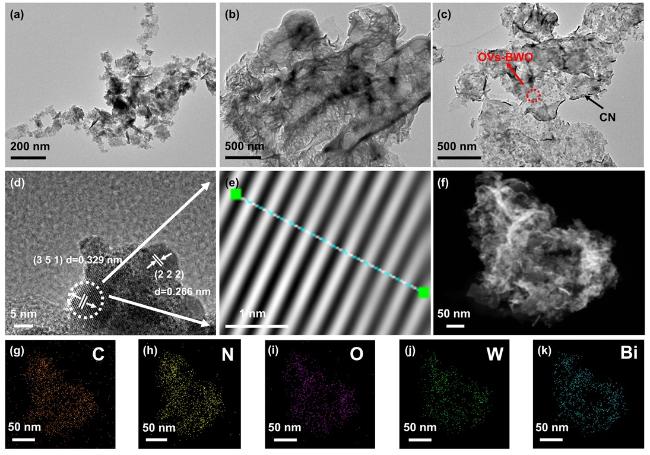
Figure 2. (a-c) TEM images of OVs-BWO (a), CN (b), 40%CN/OVs-BWO (c). (d-k) HRTEM image (d), lattice spacing (e), SEM image (f) and elemental mapping images (g-k) of 40%CN/OVs-BWO. |
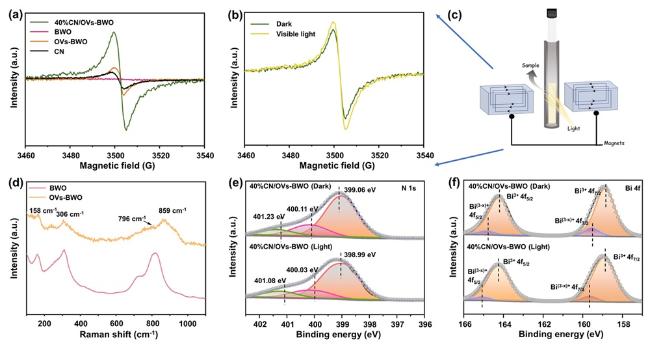
Figure 3. (a) Electron paramagnetic resonance (EPR) spectra of CN, OVs-BWO, BWO and 40%CN/OVs-BWO. (b) In situ EPR spectra of 40%CN/OVs-BWO under dark and visible light irradiation conditions. (c) Schematic illustration for the configuration of in situ EPR system. (d) Raman spectra of samples of OVs-BWO and BWO. (e, f) ISI-XPS curves of N 1s (e) and Bi 4f (f). |
Electron paramagnetic resonance (EPR) is an effective characterization method for confirming the presence of oxygen vacancies on metal oxides[22]. We thus employ EPR to characterize our prepared samples. As shown in Figure 3a, no obvious EPR signal can be observed on the BWO, suggesting its pristine structure. For the samples containing CN, an EPR peak at g = 2.0045 attributed to the lone electrons of the π-conjugated structure can be observed. For the sample containing OVs-BWO, a signal was detected at g = 2.005, which may originate from paramagnetic defect centers such as oxygen vacancies or other defects. It should be noted here that the EPR signal on CN/OVs-BWO is more intense than that on OVs-BWO because the internal electric field formed between CN and OVs-BWO can promote the density of electrons to the surface of BWO. In addition, we perform the EPR characterization over the prepared samples under dark and light irradiation conditions (Figure 3b, c)[55]. Typically, the EPR signal of the CN/OVs-BWO is enhanced under light irradiation. This is easy to understand because the presence of photogenerated electrons can increase the electron density of the CN/OVs-BWO.
Raman spectroscopy is also carried out to shed some light on the formation of the oxygen vacancies in the prepared samples. As shown in Figure 3d, the Raman peaks of OVs-BWO and bulk BWO can be assigned to the BWO. Specifically, the intense peak at 158 cm−1 is derived from the external vibration of the WO6 octahedron, and the Raman peak at 306 cm−1 can be assigned to the Eg bending mode of the WO6 octahedron. The Raman peaks at ca. 796 and 859 cm−1 correspond to anti-symmetry of terminal O-W-O groups, and symmetric Ag stretching mode, respectively. Compared to the characteristic peak of BWO, the characteristic peak of OVs-BWO increases in width and decreases in intensity due to the presence of O vacancy[56].
The optical properties and energy band structures of the prepared samples are analyzed by UV-Vis DRS spectroscopy (Figure S4)[29,57 -62]. Figure S5a shows that the absorption edge of CN is located at around 450 nm. For the BWO (Figure S5b), a light absorption edge at around 438 nm can be observed, corresponding to its bandgap value of 2.64 eV. Such a light absorption edge blue-shifts after the introduction of the oxygen vacancies on the BWO. Upon coupling CN with OVs-BWO, only a slight shift in the absorption edge position can be observed, suggesting the overlap of their light-responsive range.
To determine the specific surface area of the prepared samples, the N2 adsorption-desorption curves are obtained and shown in Figure S7. According to the Brunauer-Deming-Deming-Teller classification, the isotherms of all samples are type-IV. Specific surface areas of the prepared samples are calculated and shown in Figure S7. Typically, the BWO demonstrates a relatively low specific surface area (19.77 m2/g). Upon coupling the BWO with the CN, the specific surface area of the composite (30.71 m2/g) is slightly enlarged, due to the relatively large specific surface of CN
(43.48 m2/g). In addition, after the introduction of the oxygen vacancies on the prepared samples (i.e., OVs-BWO (58.79 m2/g) and 40%CN/OVs-BWO (56.32 m2/g)), their specific surface areas greatly increase, suggesting that the oxygen vacancies can endow enormous surface active sites on BWO.
(43.48 m2/g). In addition, after the introduction of the oxygen vacancies on the prepared samples (i.e., OVs-BWO (58.79 m2/g) and 40%CN/OVs-BWO (56.32 m2/g)), their specific surface areas greatly increase, suggesting that the oxygen vacancies can endow enormous surface active sites on BWO.
To reveal the photogenerated charge carrier migration pathway of the 40%CN/OVs-BWO, we perform in situ irradiated X-ray photoelectron spectroscopy (ISI-XPS) characterization. For high-resolution N 1s ISI-XPS spectra of 40%CN/OVs-BWO (Figure 3e), three main N 1s peaks of the 40%CN/OVs-BWO significantly shift toward lower binding energy under light irradiation, suggesting the increase in the electron density on CN during the photocatalytic reaction. In contrast, for high-resolution Bi 4f ISI-XPS spectra of 40%CN/OVs-BWO (Figure 3f), the main Bi 4f peaks of the 40%CN/OVs-BWO shift toward higher binding energy under light irradiation, indicating the decrease in the electron density on OVs-BWO. Such opposite energy density changes of CN and OVs-BWO of 40%CN/OVs-BWO upon light irradiation are in good accordance with the photogenerated charge carrier migration of the S-scheme heterojunction[63-66], which can facilitate the photogenerated charge carrier separation efficiency and optimize the redox capability of the heterojunction system.
As shown by the survey spectra of the prepared samples (Figure 4a and Figure 4b), the high-resolution C 1s and N 1s spectra of the CN and 40%CN/OVs-BWO exhibit significant peaks attributed to the CN (Figure 4c). Different from the peaks attributed to the OVs-BWO, the N 1s peaks of the 40%CN/OVs-BWO shift toward higher binding energies compared to the CN, suggesting the decrease in the electron density on the surface of CN after coupling with OVs-BWO.For the OVs-BWO, its high-resolution Bi 4f XPS spectra demonstrate two peaks at 159.10 and 164.37 eV corresponding to Bi3+ 4f7/2 and Bi3+ 4f5/2, respectively. In addition, two additional peaks at 159.86 and 165.39 eV corresponding to Bi(3−x)+ 4f7/2 and Bi(3−x)+ 4f5/2, respectively, can be also observed, suggesting the successful introduction of oxygen vacancies. After coupling with CN, all these Bi peaks are preserved, suggesting that the presence of CN does not alter the composition of the OVs-BWO. Notably, compared to the OVs-BWO, the positions of these Bi and W peaks shift toward negative binding energy(Figure 4c and Figure 4d), suggesting the increase in the electron density on the OVs-BWO after coupling with CN. For the high-resolution O 1s XPS spectrum of OVs-BWO (Figure 4e), three peaks at 532.24, 530.85 and 530.37 eV corresponding to the oxygen adsorbed on the surface, the O-atoms near the oxygen defect and the lattice oxygen, respectively. However, only surface oxygen and lattice oxygen are contained in BWO (Figure 4f), which also verifies the formation of O defects in OVs-BWO. The oxygen adsorbed on the surface and the lattice oxygen at 532.15 and 529.98 eV of 40%CN/OVs-BWO shift toward binding energy compared to the OVs-BWO, further confirming the enhanced electron density on the OVs-BWO after coupling with CN. Furthermore, such an opposite change in the electron density of the CN and BWO after formation of the 40%CN/OVs-BWO composites, suggesting the formation of the internal electric field.
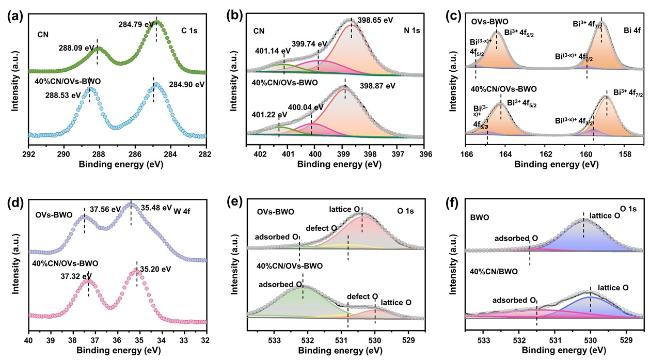
Figure 4. (a-e) High-resolution (a) C 1s, (b) N 1s, (c) Bi 4f, (d) W 4f and (e) O 1s XPS spectra of CN, OVs-BWO and 40%CN/OVs-BWO. (f) High-resolution O 1s XPS spectra of BWO and 40%CN/BWO. |
We employed femtosecond transient absorption (fs-TA) spectroscopy to further elucidate the charge transfer mechanism. For both pristine CN, Ovs-BWO and 40%CN/OVs-BWO composites (Figure 5a-c), the negative ΔA signal observed at 380 nm signifies ground-state bleaching (GSB), reflecting the depletion of ground-state electrons upon photoexcitation. As the detection time increases, the TA intensity of the CN, OVs-BWO and 40%CN/OVs-BWO catalysts decreases significantly (Figure 5d-f). When the detection time is further extended, the TA intensity of the OVs-BWO and 40%CN/OVs-BWO catalyst increases significantly. This is because the holes capture the photogenerated carriers, shortening the lifetime of the initial excited state, resulting in rapid decay of the TA signal. The occupied defect states may produce new energy level transitions and contribute to the TA signal on a longer time scale. By analyzing the GSB decay kinetics (Figure 5g-i), we investigated the interfacial electron transfer dynamics at 500 nm using multi-exponential fitting. For pure CN and OVs-BWO photocatalysts, fast electron trapping at shallow energy levels (s-EL) is observed, with short lifetimes (τ1 = 52.5 ps for CN and τ1 = 22.8 ps for OVs-BWO). The longer-lived component (τ2 = 316 ps for CN and τ2 = 365 ps for OVs-BWO) corresponds to electron-hole recombination. Notably, the 40%CN/OVs-BWO composite exhibits a significantly reduced electron trapping time (τ1 = 12.3 ps), suggesting accelerated electron migration. Moreover, the prolonged τ2 lifetime (459 ps) in 40%CN/OVs-BWO indicates enhanced charge carrier separation and suppressed recombination. In addition, the transfer dynamics of photogenerated carriers were studied by time-resolved fluorescence decay spectroscopy (Figure 5j). The average carrier decay lifetime of 40%CN/OVs-BWO (8.29 ns) is longer than that of CN (6.61 ns) and OVs-BWO (5.96 ns). These results provide compelling evidence for the efficient separation and rapid transfer of photoinduced electrons in the heterojunction system.
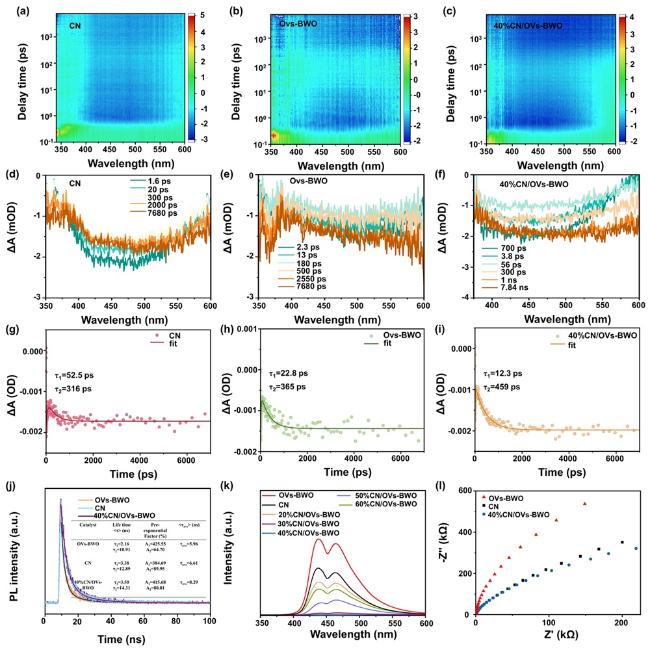
Figure 5. The pseudocolor plots of (a) CN, (b) Ovs-BWO and (c) 40%CN/OVs-BWO. Transient absorption spectra (d) CN, (e) Ovs-BWO and (f) 40%CN/OVs-BWO.The corresponding fs-TAS decay curves (at 500 nm) for (g) CN, (h) Ovs-BWO and (i) 40%CN/OVs-BWO photocatalysts. (j) Time-resolved PL spectra of theindividual photocatalysts. (k) PL spectra of CN, OVs-BWO and CN/OVs-BWO loaded with different CN contents. (l) EIS Nyquist plots of CN, OVs-BWO and 40%CN/OVs-BWO. |
The electrochemical and photoluminescence (PL) characterizations are then performed to study the photogenerated charge carrier utilization efficiency of the prepared samples (Figure 5l)[67-69]. As shown in Figure S8, the 40%CN/OVs-BWO exhibits the largest photocurrent density among all the prepared samples. Given that the 40%CN/OVs-BWO shows the lowest resistance (i.e., smallest arc radius in electrochemical impedance test, see Figure 5k), such a high photocurrent density of the 40%CN/OVs-BWO can be attributed to its enhanced photogenerated charge carrier migration efficiency[70,71]. The PL spectroscopy further collaborates this inference, where the 40%CN/OVs-BWO demonstrates the lowest PL intensity among all the samples because the formation of the heterojunction between CN and OVs-BWO can significantly inhibit the recombination of photogenerated electrons and holes, and facilitate the photogenerated charge carrier migration efficiency.
After confirming the physicochemical properties of the prepared samples, we investigate and compare their photocatalytic CO2 conversion performance (Figure 6a). Based on the gas-chromatography results, we find that the CO is the main CO2 conversion product of the prepared samples. As shown in Figure 6b, the photocatalytic CO2 conversion for CO production performance of the OVs-BWO (1.94 μmol h−1g−1) is significantly higher than that of BWO (0.95 μmol h−1g−1), because the oxygen vacancies can endow enormous surface active sites for the catalytic reaction. Notably, the optimized 40%CN/OVs-BWO composite demonstrates the highest CO production rate of
48.65 μmol h−1g−1 among all the prepared samples, which is ca. 20 times and 25 times higher than the CO production rate of CN (2.38 μmol h−1g−1) and OVs-BWO, respectively. More interestingly, the CO production rate of 40%CN/OVs-BWO is about
9.23 times higher than that of 40%CN/BWO
(5.27 μmol h−1g−1), implying the synergistic effect between the oxygen vacancies on BWO and heterojunction formed between OVs-BWO and CN. The AQY value generated by CO on 40%CN/OVs-BWO is 0.1145%. Such a CO production rate is also exceeding most of the photocatalytic CO2 conversion performance of recently reported photocatalytic systems for CO production (Table S1, Figure 6c). It can be clearly shown in Figure S9 that there is a linear relationship between time and CO2 reduction process CO yield. No obvious decrease in photocatalytic CO2 conversion performance can be observed over 40%CN/OVs-BWO for four cycles of recycling test (Figure 6d). In addition, the XRD characterization indicates that the phase structure of the 40%CN/OVs-BWO does not alter after the recycling test, implying its high photostability (Figure S10). Control experiments shown in Figure 6e further prove that light and photocatalysts are indispensable aspects of photocatalytic CO2 conversion. CO production can hardly be detected when performing the photocatalytic CO2 conversion test in the dark, without catalyst and without CO2 conditions.
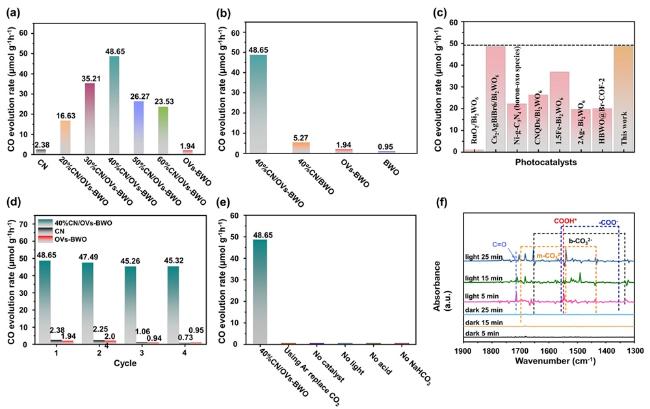
Figure 6. (a) Comparison of the photocatalytic CO2 conversion performance of the CN/OVs-BWO with different CN loading contents for CO production. (b) Comparison of the photocatalytic CO2 conversion performance of the CN, BWO, OVs-BWO and CN/OVs-BWO for CO production. (c) Comparison of the photocatalytic CO2 conversion of the 40%CN/OVs-BWO with the previously reported photocatalysts. (d) Recycling photocatalytic CO2 conversion tests over CN, OVs-BWO and CN/OVs-BWO. (e) CO2 photocatalytic activity under varied conditions. (f) In situ diffuse reflectance infrared Fourier transform spectra for photocatalytic CO2 conversion over 40%CN/OVs-BWO. |
Furthermore, we employ in situ diffuse reflectance infrared Fourier transform spectroscopy to explore intermediates formed during 40%CN/OVs-BWO photoreduction. As shown in Figure 6f, the peaks at 1697, 1541 and 1434 cm−1 are attributed to monodentate carbonate species (m-CO32−). Meanwhile, m-CO32− and bidentate carbonate b-CO32− (1653 and 1334 cm−1) are derived from CO2 species adsorbed on the sample surface. The characteristic peaks at 1354 and 1557 cm−1 correspond to COO− and the characteristic peak at around 1548 cm−1 can be assigned to COOH* groups. In addition, a peak of CO at ca. 1715 cm−1 can be also observed, suggesting the production of CO. Based on these results, it can be concluded that the CO2 and H2O are first adsorbed on the surface of 40%CN/OVs-BWO. The presence of CN and oxygen vacancies on the 40%CN/OVs-BWO can significantly facilitate this process by endowing the photocatalyst with a large specific surface area and enormous surface active sites. Subsequently, the surface protons can interact with the adsorbed CO2* species to produce COOH*. The intermediate COOH* molecule is then reduced to CO*.
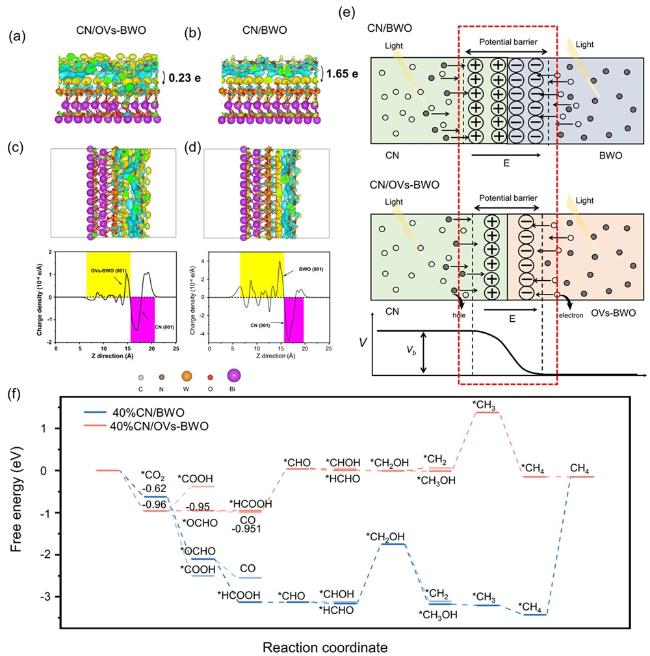
Figure 7. (a, b) Side view of CN/OVs-BWO (a) and CN/BWO (b). (c, d) Bader charges analysis atoms of the isosurface of CN/OVs-BWO (c) and CN/BWO (d). (e) Schematic illustration of the shrinkage of the potential barrier of CN/OVs-BWO compared to that of the CN/BWO. Vb and E indicate potential barrier and electric field, respectively. (f) Gibbsfree energy profiles for CO2 photoreduction on CN/OVs-BWO and CN/BWO. |
4 Conclusion
In summary, we have successfully shown the possibility of controlling the internal electric field of the S-scheme heterojunction for enhanced photocatalytic performance. Specifically, we couple the OVs-BWO with the CN to form an S-scheme heterojunction. Surprisingly, the OVs-BWO not only demonstrate the typical advantages of the oxygen vacancies including enhanced light absorption, enlarged surface active sites and accelerated photogenerated charge carrier separation efficiency, but also show unique capability in tuning the electric field form between OVs-BWO and CN. According to the materials calculations, the potential barrier formed on CN/OVs-BWO is significantly lower than that on CN/BWO, allowing the rapid migration of photogenerated charge carriers from OVs-BWO to CN. As a result, the photocatalytic CO2 conversion performance of optimized CN/OVs-BWO (48.65 μmol h−1g−1) is ca. 20 times higher than that of CN and OVs-BWO, respectively. This work demonstrates the synergistic effect between the oxygen vacancies and S-scheme heterojunction, which can shed some important light on the design of the highly-efficient photocatalytic system.
Declaration of Competing Interest
The authors declare that they have no known competing financial interests or personal relationships that could have appeared to influence the work reported in this article. Kai Dai and Jingxiang Low are Editorial Board Members of this journal and they were not involved in the editorial review or the decision to publish this article.