

1. Introduction
The global energy transition and pursuit of “dual carbon” strategic goals have intensified research into efficient and stable materials for energy storage and conversion [1,2]. The properties of a single-phase structural material are predominantly determined by its intrinsic characteristics, such as chemical composition and crystalline structure. Altering its properties typically requires modifying the material itself—for instance, through alloying—which may inadvertently increase overall weight and cost. Conventional bulk materials contain limitations, including sluggish ion diffusion kinetics, low utilization of active sites, and inadequate cycling stability (e.g., significant volume expansion and particle fragmentation in silicon anodes leading to rapid capacity decay). These constraints impede their ability to meet the performance demands of next-generation energy devices. Consequently, hollow-structured materials [3-9], defined by their precisely delineated outer boundaries and enclosed internal voids, have garnered substantial research interest. Their unique morphology confers critical advantages: low mass density, elevated specific surface area, minimized charge/material transport distances, and high volumetric loading capacity for active components [10]. These intrinsic attributes render them highly attractive across diverse energy technologies.
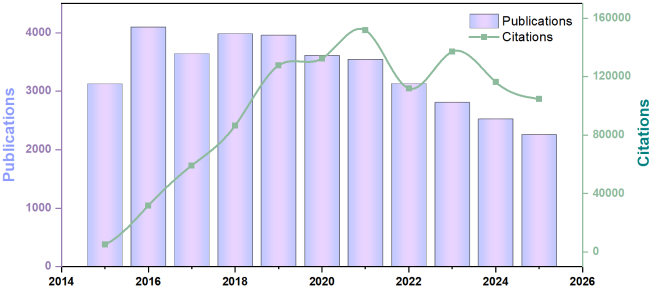
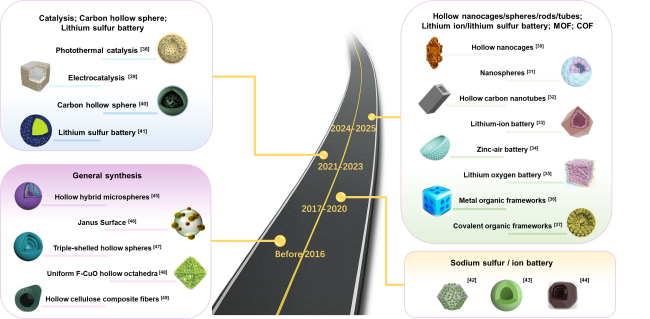
Figure 1 Number of citations and publications of research on hollow-structured materials in Web of Science over time. |
Hollow materials are characterized by distinct internal/external interfaces and enclosed voids. Based on complexity, they are categorized as: Single-shell structures: A single shell enclosing a cavity. Multi-shell structures: Multiple concentric shells forming independent chambers, attracting significant interest due to superior physicochemical properties [2,11]. Their intricate, precisely controlled architecture often outperforms single-shell structures and bulk materials.
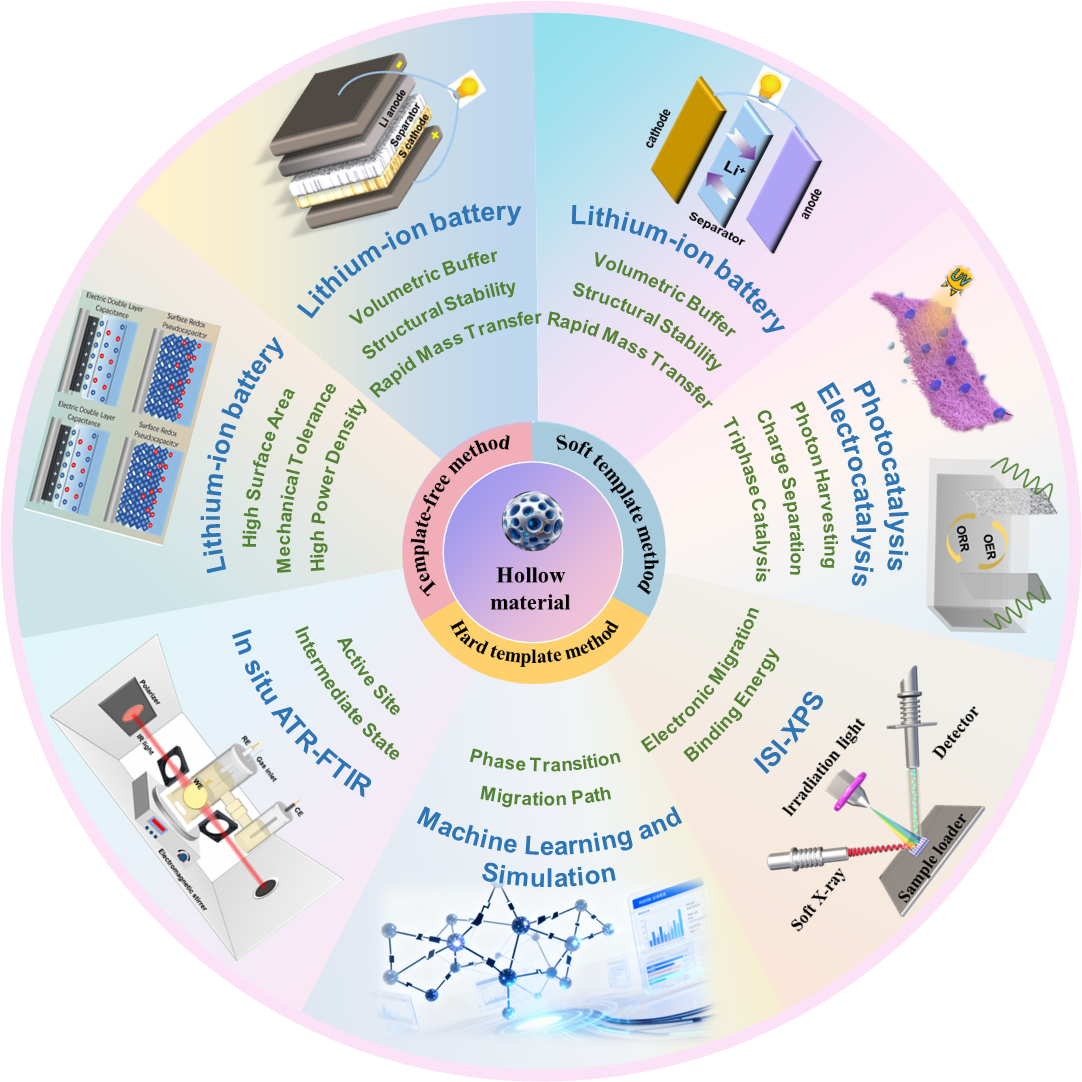
The synergy of low density, high porosity, and short transport pathways makes hollow structures pivotal for overcoming bottlenecks in energy storage and conversion, finding broad utility in fields like nanoreactors, catalysis, and fuel cells (Scheme 1 illustrates key applications). Hollow architectures effectively mitigate detrimental volumetric expansion during electrochemical cycling and suppress polysulfide migration in lithium-sulfur systems. Their porous shells provide abundant active sites, enhance photon management, while multi-shell or hierarchical designs optimize mass transport pathways and boost energy density [10]. Consequently, they find extensive application in:
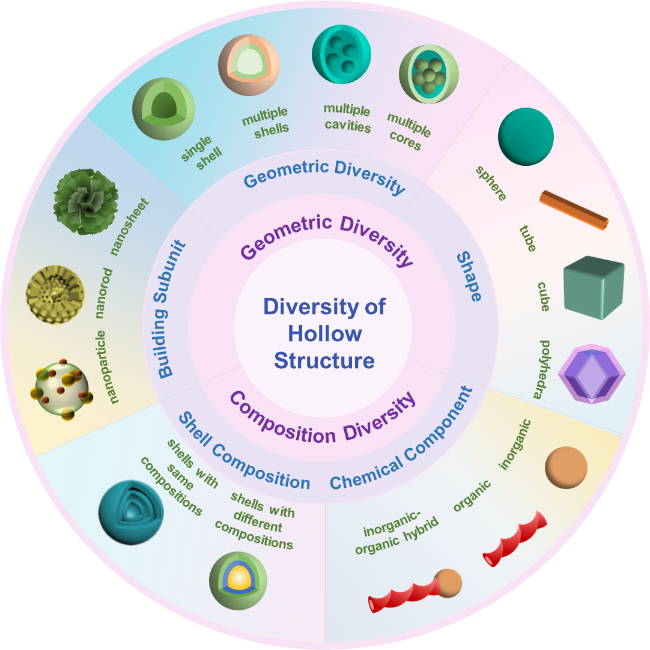
Scheme 2 Diversity of hollow structure. |
i) Lithium-ion batteries (LIBs): Provide abundant accessible storage sites, expanded electrode/electrolyte interfaces, shortened transport distances, and internal voids buffering volumetric expansion, enhancing specific capacity and cycling stability.
ii) Lithium metal anodes: Serve as hosts decreasing local current density, inhibiting Li dendrite growth, stabilizing the SEI, and restricting volume expansion [12].
iii) Lithium-sulfur (Li-S) batteries: Offer high pore volume for efficient sulfur loading. Heteroatom doping or heterojunction formation within the hollow architecture significantly enhances polysulfide anchoring and adsorption, mitigating the shuttle effect and improving capacity/cycle life [12,13].
iv) Dye-sensitized solar cells (DSSCs): As photoanodes, enhance light harvesting via multiple internal reflections within the shell, enable high-density dye adsorption, facilitate electrolyte infiltration, and shorten charge transport distances [14].
v) Electrocatalysis: enable compartmentalization of distinct catalysts within sequential localized shells for cascade reactions. Shell pore structure and chemistry can be regulated to optimize reaction selectivity.
vi) Photocatalysis and photoelectrochemical: Provide large surface areas for catalytic sites, shorter charge carrier paths, and internal light-trapping effects for efficient photon collection [15].
For example, the HCT-x@Co3O4@SnS2 core multi-shell structure features an inner conductive hollow carbon tube (HCT) core promoting electron transport and shortening ion diffusion. The outer Co3O4@SnS2 layer leverages Co3O4 pseudo capacitance (Co2+/Co3+ redox) and SnS2 nanosheets providing abundant Faradaic reaction sites. This design achieves 63.5% capacity retention after 15, 000 cycles and enables flexible supercapacitors with an energy density of 40.22 Wh·kg-1 and power density of 750.22 W·kg-1 [16]. Similarly, “pomegranate-like” Si@C structures encapsulate nano-silicon within porous carbon microspheres, effectively mitigating silicon volume expansion and active material loss while enhancing areal capacity and volumetric energy density [17].
Substantial progress has been achieved in the synthesis and structural regulation of hollow materials, with established synthesis strategies broadly classified into three primary categories including hard templating, soft templating, template-free methods. This methodological diversity has directly enabled the development of hollow materials exhibiting extreme complexity in both composition and geometry (Scheme 2). Compositionally, they span single inorganic phases (oxides, sulfides, nitrides), organic polymers (e.g., polypyrrole, polyethylene terephthalate), and inorganic/organic hybrids (e.g., MOF-derived materials) [18-20]. Hybrid systems leverage synergistic effects and efficient electron transfer to optimize adsorption/desorption energetics of reaction intermediates (e.g., in electrocatalysis). Abundant heterogeneous interfaces induce charge redistribution, regulate electronic structure, lower activation barriers, and enhance catalytic activity. Furthermore, these structures combine stability with mass transfer advantages, suppressing nanoparticle aggregation while promoting electrolyte penetration [21]. Geometrically, beyond traditional spheres and tubes, diverse non-symmetrical configurations have been achieved (cubes, polyhedrons, prisms, bowls) [16,22 -24]. Surface curvature control and interface reaction dynamics further refine these shapes. This multidimensional diversity enables precise performance optimization through structural and compositional engineering.
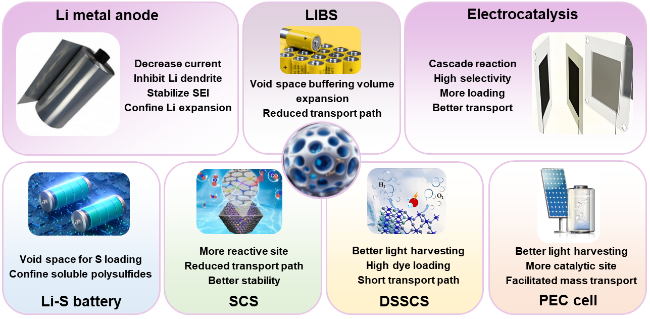
Scheme 1 Advantages of hollow nanostructures for energy storage applications. |
For instance, hierarchical aerogels integrating 3D spiral carbon nanowire coils, 2D reduced graphene oxide, 1D carbon nanofibers, and 0D Fe3O4@C core-shell particles create porous frameworks and gradient interfaces for enhanced microwave absorption [25]. Multi-shell/chamber structures (e.g., double-shell CoMn2O4 cubes [26]) synergistically enhance mechanical stability and interfacial reactivity. Chemically graded shells (e.g., magnetic Fe2O3/sub-black TiO2 heterojunctions [27]) optimize charge separation via bandgap engineering. These examples illustrate how multidimensional design addresses specific energy challenges like electrode expansion and photo-generated carrier recombination.
Despite significant progress, the fundamental structure-performance relationships in hollow materials warrant deeper understanding. This review systematically dissects the correlation between hollow architectural features (composition, geometry, hierarchy) and their performance across key energy applications (LIBs, Li-S, SCs, photo/electrocatalysis). By analyzing representative design strategies, we elucidate the critical role of structural engineering in dictating function. Furthermore, prospective design methodologies are proposed to address current challenges and enhance the efficacy of hollow nanostructures in future energy storage, conversion, and generation technologies.
2. Synthesis Methods of Hollow Structures
The innovation and optimization of hollow structures synthesis methodologies constitute a major research focus in materials science. Based on core preparation principles, synthetic strategies are systematically categorized into two primary routes: template-assisted and template-free methods [48].
Template-assisted methods employ sacrificial molds for structural control: Hard templating utilizes rigid sacrificial templates (e.g., SiO2, polystyrene microspheres, carbon). Precise control over shell thickness and cavity size is achieved via layer-by-layer deposition followed by template removal. This method excels at producing multi-shell structures, as demonstrated by scalable sequential templating using carbon microspheres (CMS) to synthesize complex multi-shell hollow metal oxides in a single annealing step [49-51]. Soft templating employs dynamic assemblies (e.g., micelles, emulsions, bubbles, surfactant aggregates) to form cavities, facilitating the controlled synthesis of flexible organic or composite materials [52,53].
Table 1 Typical research contents related to hollow-structured materials in Scheme 3. |
| Year | Hollow structural materials type | Synthetic method | Ref. |
|---|---|---|---|
| 2024-2025 | Hollow nanocages | Template-free method | [30] |
| Hollow nanospheres | Template-free method | [31] | |
| Hollow nanotubes | Template-free method | [32] | |
| Hollow core-shell dodecahedra | Hard template method | [33] | |
| Hollow bowl | Hard template method | [34] | |
| Hollow nanocage | Template-free method | [35] | |
| Hollow metal organic frameworks | Template-free method | [36] | |
| Hollow covalent organic frameworks | Soft template method | [37] | |
| 2021-2023 | Hollow core-shell nanoparticles | Hard template method | [38] |
| Hollow nanocubes | Hard template method | [39] | |
| Carbon hollow spheres | Hard template method | [40] | |
| Hollow microspheres | Hard template method | [41] | |
| 2017-2020 | Hollow Janus-Featured | Hard template method | [42] |
| Hollow nanospheres | Hard template method | [43, 44] | |
| Before 2016 | Hollow hybrid microspheres through inward crystallization process | Template-free method | [45] |
| Hollow carbon nitride structure with a Janus Surface | Hard template method | [46] | |
| Triple-shelled hollow spheres | Template-free method | [47] | |
| Uniform F-CuO hollow octahedra | Template-free method | [48] | |
| Hollow materials by fast pyrolysis of cellulose composite fibers | Template-free method | [49] |
Scheme 3 A brief timeline of the development history of research on the synthesis and application of hollow-structured materials. |
Template-free methods exploit intrinsic material phenomena for cavity formation, including Ostwald ripening (driven by dissolution-reprecipitation kinetics), the Kirkendall effect (resulting from differential diffusion rates between core and shell materials), ion exchange (inducing structural rearrangement), and selective etching (removing a sacrificial component from a binary precursor), which approaches significantly simplify preparation by eliminating template constraints [54-56].
2.1 Hard Template Synthesis
Hard template method represents a foundational strategy for fabricating hollow architectures. This approach utilizes pre-formed, rigid sacrificial templates (e.g., inorganic or polymeric microspheres) as three-dimensional molds. The synthesis involves sequential deposition of target material precursors onto the template surfaces, followed by selective template removal, yielding defined hollow structures [57]. Renowned for its simplicity, versatility, and efficacy, this method is extensively employed for hollow nanostructure preparation. Templates are broadly categorized as inorganic (e.g., SiO2, Al2O3) or organic/polymer (e.g., polystyrene (PS), polymethyl methacrylate (PMMA)).
Fundamental synthesis typically comprises four critical stages:
i) Template fabrication: Preparation of sacrificial templates with precise morphology and size control.
ii) Surface functionalization (optional): Modification of template surfaces to enhance interfacial adhesion with the target material. This step is circumvented if inherent compatibility exists between the template and the target precursor [11].
iii) Target material deposition: Controlled coating or deposition of the functional material onto the template surface. This stage is often the most technically demanding, requiring meticulous parameter optimization to achieve precise shell layer thickness and uniformity, which are paramount for structural integrity [17].
iv) Template removal: Selective elimination of the sacrificial template via chemical etching or thermal decomposition, resulting in the hollow architecture.
These strategies traces its origins to Caruso et al. (1998), who pioneered colloidal templating combined with layer-by-layer (LbL) self-assembly [58] (Figure 2b). PS microspheres served as templates. Charged polymers (e.g., PDDA, PSS) were alternately deposited to form a uniform pre-coating, facilitating subsequent electrostatic assembly of SiO2 nanoparticles. Controlled deposition cycles regulated shell thickness. Calcination or solvent decomposition removed the PS core, yielding mesoporous SiO2 hollow spheres with tunable cavities, valuable for applications like drug delivery and catalysis. Subsequent research expanded material scope and structural complexity.
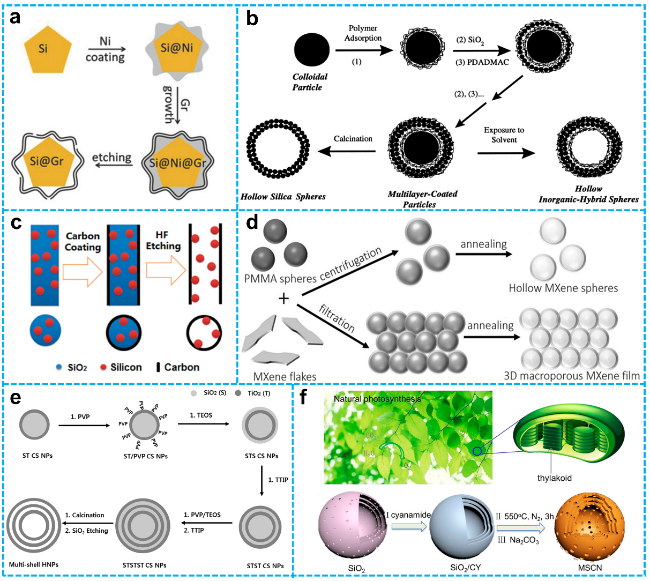
Figure 2 a) Schematic diagram of the synthesis of SiMP@Gr yolk-shell structure [59]. Copyright 2016, Springer Nature. b) Description of synthetic protocols for inorganic and hybrid hollow spheres [58]. Copyright 1998, The American Association for the Advancement of Science. c) Overview of the manufacturing of hollow carbon tubes encapsulated with Si nanoparticles [60]. Copyright 2012, American Chemical Society. d) Diagram illustrating the synthesis of hollow MXene spheres and MXene-Derived 3D macroporous frameworks [61]. Copyright 2017, John Wiley and Sons. e) Schematic illustration for the hard templating synthesis of TiO2 TSHSs [62]. Copyright 2014, John Wiley and Sons. f) Schematic illustration for the hard templating synthesis of MSCN [63]. Copyright 2017, American Chemical Society. |
Cui et al. synthesized SiMP@Gr yolk-shell structures by employed a dual-functional Ni template [59] (Figure 2a). Conformal Ni coating on Si microparticles acted as both a catalyst for low-temperature graphene nucleation/growth via dissolution-precipitation-assisted carbonization and a sacrificial buffer layer. Selective Ni etching (FeCl3(aq)) created a mechanically flexible graphene cage. This structure enhances Si anode stability by: (1) buffering Si volume expansion while maintaining electrical contact; (2) suppressing electrolyte side reactions via an inert graphene interface, promoting stable SEI formation and reducing Li+ consumption; (3) inhibiting Si particle pulverization via 3D confinement, achieving 90% capacity retention over 100 cycles in full cells.
SiO2 nanofibers encapsulating silicon nanoparticles (Si NPs) were prepared by electrospinning a precursor solution containing tetraethyl orthosilicate (TEOS) and Si NPs, ultimately leading to the formation of SiO2-templated Si@hollow carbon tubes [60] (Figure 2c). The SiO2 layer served as substrate and spacer. Low-temperature polystyrene pyrolysis deposited a continuous carbon coating. Selective SiO2 etching (HF(aq)) produced hollow carbon tubes containing Si NPs suspended within, buffering volume changes. The carbon shell stabilizes electrical contact and isolates Si from the electrolyte, stabilizing SEI formation.
PMMA spheres templated hollow MXene (e.g., Ti3C2Tx) structures [61] (Figure 2d) show MXene flakes, interacting via surface hydroxyl groups, spontaneously wrapped PMMA spheres. Centrifugation yielded MXene/PMMA composites. Argon annealing (450°C) thermally decomposed PMMA, forming multi-layered MXene hollow spheres with tunable wall thickness (via MXene:PMMA ratio). These structures exhibit excellent dispersibility and potential in environmental and biomedical applications. The method demonstrates universality for other MXenes (e.g., V2CTx, Mo2CTx).
These hard template methods versatility extends to synthesis of complex multi-shell hollow structures (MSHSs) via sequential deposition of functional shell components and removable intermediate layers onto the initial template, followed by differential etching [49].
Jang et al utilized Stöber SiO2 spheres as the core template to synthesis TiO2 multi-shell hollow spheres [62] (Figure 2e). Alternating TiO2 and SiO2 layers were deposited via sol-gel processing, constructing core-shell composites (e.g., single-, triple-, quintuple-layer). High-temperature calcination removed organics, followed by alkaline etching to remove all SiO2 components, yielding TiO2 hollow spheres with single- (SSHS), double- (DSHS), or triple-shell (TSHS) structures.
Tong et al. employed pre-synthesized multi-shell SiO2 nanospheres as templates to form multi-shell g-C3N4 (MSCN) nanocapsules [63] (Figure 2f). Cyanamide (CY) precursor infiltrated the mesopores and cavities of the SiO2 shells, adsorbing onto the shell surfaces. Thermal polymerization (550℃) formed SiO2/g-C3N4 composites. Sequential addition of TEOS/BTME mixtures and thermal processing built up SSHS, DSHS, or TSHS composite structures. Final Na2CO3(aq) etching removed the SiO2 template, yielding MSCN nanocapsules with a hollow core and multi-layered mesoporous shell.
2.2 Soft Template Synthesis
The soft template method is a synthetic technique for synthesizing hollow structures, utilizing dynamic self-assembling molecules—surfactants, block copolymers, micelles, or vesicles as structural templates. This approach exploits the thermodynamically metastable assemblies formed by amphiphilic molecules in solution (e.g., micelles, vesicles, or emulsion droplets) to direct the oriented deposition of target materials onto the template surface. Subsequent removal of the soft template yields the final hollow architecture [64-70].
Unlike hard templating, which relies on pre-synthesized rigid structures (e.g., SiO2 or polystyrene spheres), the soft template method employs inherently dynamic templates. These templates form in situ during the reaction via spontaneous self-assembly driven by intermolecular non-covalent interactions, such as hydrophobic effects and hydrogen bonding. This dynamic nature provides significant flexibility for controlling critical structural parameters of the resultant hollow materials, including shell layer number, porosity, and overall morphology. Consequently, soft templating is particularly well-suited for synthesizing complex architectures featuring multi-level porosity or flexible frameworks [52].
The assembly behavior of soft templates is highly sensitive to synthetic parameters, including temperature, solvent polarity, pH, amphiphilic molecule concentration, ionic strength, and the presence of organic/inorganic additives. Theoretically, this parameter dependence offers a pathway for precise morphological control over micellar/vesicular templates, enabling regulation of template size, packing density, and interfacial properties through manipulation of the solution environment. However, in practice, the complexity of multi-component reaction systems poses significant challenges to template stability. The introduction of target precursors (e.g., metal salts, silicon sources, or carbon sources) can disrupt the dynamic equilibrium of micelles/vesicles through competitive adsorption, potentially leading to template deformation or disintegration. This instability has historically limited the broad applicability of soft templating for synthesizing multi-component and heterogeneous materials.
Despite these challenges, researchers have developed strategies as precursor-template cooperative assembly, enabling breakthrough syntheses of multi-shelled hollow structures (MSHS) across diverse material classes, including silica, metal oxides, and sulfides.
Within the domain of photocatalytic materials research, Guo et al. synthesized surface sulfur-vacancy-rich hollow ZnIn2S4 nanocages (ZIS-HNCs) via soft templating. These structures form robust interfaces with NiCo2S4 (NCS), facilitating efficient transfer and accumulation of photo-generated electrons on the NCS surface (Figure 3a). The hollow architecture enhances light absorption via multiple scattering, while sulfur vacancies promote electron accumulation and consumption. This synergy excites photo-generated electrons in NCS into long-lived hot electrons, culminating in a remarkable visible/near-infrared photocatalytic hydrogen production rate of 19, 654.0 μmol·g-1·h-1 (Figure 3b), an apparent quantum efficiency of 56.7% at 400 nm (Figure 3c), and a reduced apparent activation energy (from 49.6 kJ·mol⁻¹ to 32.2 kJ·mol-1, Figure 3d) [52].
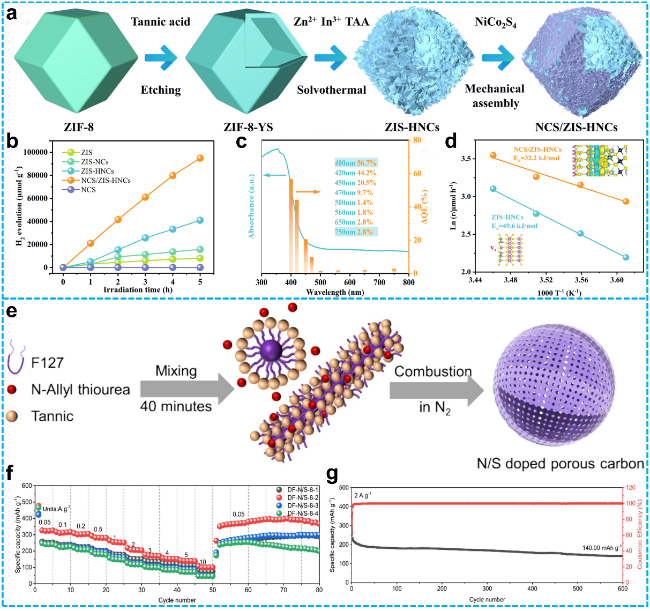
Figure 3 a) Schematic illustration of the fabrication pathway for NCS/ZIS-HNC heterostructures; Photocatalytic hydrogen evolution (PHE) performance of the prepared samples; c) Apparent quantum efficiency (AQE) and diffuse reflectance spectroscopy (DRS) spectral data for NCS/ZIS-HNCs; d) Temperature-dependent PHE rate analysis of ZIS-HNC and NCS/ZIS-HNC materials [52]. Copyright 2023, Royal Society of Chemistry. e) Schematic diagram of the synthetic procedures for DF-N/S-8-2; f) Rate capability at different doping levels; g) Cycling stability tested at a current density of 2 A·g-1 [53]. Copyright 2024, Elsevier. |
In battery anodes research, Zhang et al. employed a soft-template-induced self-assembly strategy using biomass-derived tannic acid as a precursor, Pluronic F127 as the template, and N-allyl thiourea as a dopant to synthesize N/S co-doped porous carbon spheres (DF-N/S) (Figure 3e). As a sodium-ion battery anode in an ether-based electrolyte, DF-N/S delivers a high specific capacity of 327.04 mA·h·g-1 at 0.05 A·g-1 (Figure 3f) and maintains 140 mA·h·g-1 after 600 cycles at 2 A·g-1 (Figure 3g). Its exceptional performance is attributed to the porous structure facilitating Na+ transport, N/S doping increasing active sites, and the formation of a thin SEI layer with rapid Na+ diffusion kinetics in the ether-based electrolyte [53].
In silica-based systems, silica and its derivatives represent highly successful applications of soft templating, benefiting from the precise control over silicon precursor hydrolysis and condensation in aqueous solutions. Zhang et al. utilized Pluronic P85 triblock copolymer as a single template, adjusting synthesis pH (4.8-5.5) to achieve controlled preparation of organic silica-based multilamellar vesicles. This mild system produces vesicles in high yield (> 90%), with wall layer count tunable from seven to a single layer. The vesicle walls feature a 6 nm mesoporous sponge-like structure, exhibiting a high specific surface area (695 m2·g-1) and large pore volume (2.10 cm3·g-1) [71]. Liu et al. employed vesicular templates formed by co-assembly of FC4/F127 dual surfactants. By controlling the template ratio and reaction conditions (pH 9.8-12.2), they synthesized mesoporous silica hollow spheres with uniform size and tunable shell layers. Ethanol content and ammonia addition allowed precise control over shell number, thickness, and meso-porosity. The resulting material demonstrated specific adsorption capacity for methylene blue (25 mg·g-1) and high drug loading/release capabilities (e.g., 448 mg·g-1 ibuprofen) [68].
2.3 Template-Free Synthesis
2.3.1 Selective Etching
Selective etching is a synthetic strategy for constructing hollow structures by exploiting inherent chemical property differences within a material to selectively remove specific regions via chemical dissolution, eliminating the requirement for external templates. The core principle involves precise control of etching conditions to preferentially dissolve chemically less stable (“soft”) regions while preserving more stable (“hard”) regions, which subsequently act as structural supports. This intrinsic self-etching mechanism, proceeding from the interior outwards, circumvents the limitations of traditional template-based methods and provides a versatile pathway for the controlled synthesis of complex multi-shell architectures.
Conceptually, the selective etching process for generating hollow materials resembles the template removal step in hard templating [72]. Yet a critical distinction lies in the initial template: as it possesses homogeneous composition and structure, creating a differential in solubility or chemical stability between the inner and outer regions is essential. This differential susceptibility enables targeted etching leads two primary approaches upon this:
Surface-protected etching utilizes a stabilizer coating to protect the outer shell surface, confining the etchant action to the interior [72,73]. For instance, Liang et al. demonstrated this by forming a protective polyvinylpyrrolidone (PVP) layer on silica spheres. This confined the NaOH etchant action predominantly within the sphere core, generating a mesoporous structure. This modification significantly enhanced the material's specific surface area (161.1357 m2·g-1) and pore volume (0.5591 cm3·g-1). Furthermore, the resulting quantum confinement effect facilitated the uniform dispersion of Fe3O4 nanoparticles, increasing the iron loading to 32.67 wt% (approximately double that of the unetched material). Enhanced surface wettability, evidenced by a reduced water contact angle (from 43.6° to 21.24°), further optimized interaction efficiency between the catalyst and pollutants [74].
Intrinsic stability gradients approach leverages differential chemical stability inherently formed during the initial template synthesis. Regions with lower stability (“soft” regions) are selectively etched, while higher stability (“hard” regions) remain intact. Wang et al. exemplified this strategy by utilizing the alkaline etching effect of ethylenediamine (EDA) under template-free hydrothermal conditions. EDA preferentially etched the inner core of amorphous titanium dioxide spheres, characterized by low polymerization degree. Concurrently, the outer, highly crystalline titanium dioxide layer resisted etching, forming a porous shell. Complete dissolution of the inner core resulted in hollow cavities. The addition of NaCl further modulated the oriented assembly of hydrated titanium oxide nanosheets into layered hollow microspheres [75]. Similarly, Cheng et al. developed a solvent-selective etching strategy for carbon microspheres. Following phenolic resin microsphere formation, acetone dissolved the low-molecular-weight oligomers within the core, while the highly cross-linked outer shell remained intact. This template-free process yielded multi-chamber mesoporous carbon microspheres (MCMCs). Crucially, the number of internal pores and mesopore distribution could be precisely tuned by varying the acetone volume (20-80 mL), with an optimized hierarchical pore structure achieved at 60 mL [76].
2.3.2 Ostwald Ripening
Ostwald ripening, a phenomenon driven by disparities in crystal surface energy, describes the spontaneous dissolution of smaller, higher-surface-energy nanocrystals and the subsequent redeposition of the dissolved material onto larger crystals [55]. This self-organizing mechanism offers distinct advantages for the template-free synthesis of hollow structures. By manipulating the dissolution-recrystallization equilibrium, it facilitates the in-situ transformation of solid nanoparticles into hollow architectures, circumventing the complexities associated with template preparation and removal. This approach is particularly effective for metal oxide systems exhibiting significant solubility variations as Co3O4 [77], Mn3O4 [78], and TiO2 [79].
Research demonstrates that multi-step Ostwald ripening strategies enable the precise construction of multi-shell structures [80]. For instance, Zhang et al. achieved controlled structural evolution in nanospheres by precisely regulating hydrothermal reaction time (0.5-18 hours) (Figure 4a): i) Initial stage (0.5 h): Formation of solid nanoparticles. ii) Intermediate stage (1-6 h): Internal-to-external Ostwald ripening yields a single-shell structure. iii) Shell formation stage (7-10 h): External-to-internal ripening drives dissolved nanoparticle redeposition onto the inner surface, forming a double-shell structure. iv) Late stage (> 10 h): Gradual dissolution of the inner shell reverts the structure to a single shell.
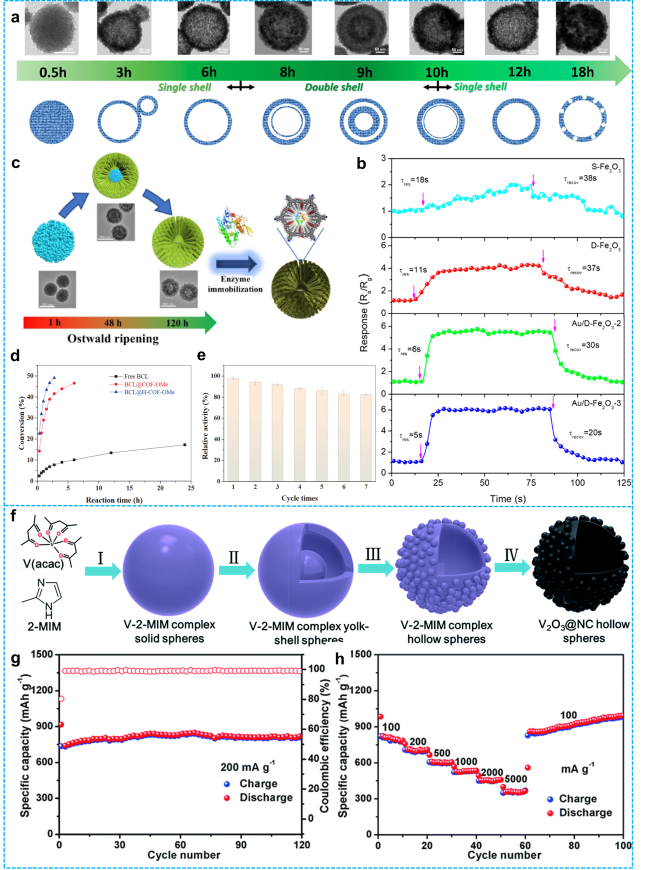
Figure 4 a) Structural evolution of Fe2O3 spheres as a function of reaction duration; b) Dynamic response profiles of four gas sensors to 10 ppm acetone at 200°C [81]. Copyright 2019, American Chemical Society. c) Self-template method for preparing hollow lipase (BCL@H-COF-OMe) via Ostwald ripening mechanism; d) Comparison of catalytic performance of different catalysts for kinetic resolution of l-phenyl ethanol; e) Recycling catalytic performance tests of BCL@H-COF-OMe for kinetic resolution of 1-phenylethanol [55]. Copyright 2022, Springer Nature. f) Schematic representation of the formation process for uniform V2O3@NC hollow spheres; g) Cycling stability at a low current density of 200 mA·g-1; h) Rate capability at current densities of 100, 200, 500, 1000, 2000, 5000, and back to 100 mA·g-1 [82]. Copyright 2018, Royal Society of Chemistry. |
This entirely template-free process relies solely on the dissolution-redeposition mechanism governed by nanoparticle surface energy gradients: material dissolves preferentially from high-energy regions, diffuses through pores, and recrystallizes in low-energy regions. The dynamic equilibrium allows precise temporal control over shell number with high reproducibility. The resulting double-shell structure exhibits enhanced specific surface area and porosity.
Loading with Au nanoparticles (Au/D-Fe2O3) leverages synergistic structural and catalytic sensitization, achieving a remarkably low acetone detection limit (0.132 ppm), rapid response time (5 s), high sensitivity (0.465 ppm-1), and selectivity (Figure 4b). This methodology overcomes limitations of conventional templating and provides novel design principles for high-performance gas sensors [81].
Liu et al. applied Ostwald ripening to the large-scale synthesis of hollow covalent organic frameworks (COFs) for biocatalysis. Self-assembly of TAPB and DMTA monomers in acetonitrile/acetic acid initially forms solid microspheres (1-12 h). Subsequent internal dissolution-reprecipitation via Ostwald ripening progressively evolves these into an eggshell structure (24-72 h), culminating in uniform hollow spheres (diameter: 580 nm; shell thickness: 122 nm) (Figure 4c). Immobilizing Burkholderia cepacia lipase (BCL) on these hollow COFs (BCL@H-COF-OMe) significantly enhanced its thermal stability, tolerance to polar organic solvents, and reusability. In the kinetic resolution of secondary alcohols, BCL@H-COF-OMe outperformed both non-hollow COF-immobilized and free enzymes, achieving a maximum conversion of 49.12% (Figure 4d). Furthermore, BCL@H-COF-OMe retained high activity over multiple cycles with only a slight decrease in relative activity (Figure 4e), demonstrating excellent reusability while maintaining enantiomeric excess (ee) > 99% [55].
Han et al. utilized solvothermal Ostwald ripening to achieve morphological evolution from solid microspheres to hollow spheres (Figure 4f): i) Initial stage (3 h): Formation of solid V-2-MIM composite microspheres. ii) Intermediate stage (6 h): Internal dissolution and outer shell recrystallization transform the structure into an eggshell morphology. iii) Final stage (12 h): Complete core consumption yields uniform nitrogen-doped carbon-coated V2O3 hollow spheres. Driven by minimization of the system's Gibbs free energy, material preferentially dissolves from low-curvature regions, diffuses through solution, and precipitates onto external high-curvature regions, promoting shell densification. This spontaneous mechanism eliminates the complex steps of traditional templating, producing submicron-scale hollow structures (~200 nm diameter, ~30 nm shell thickness) composed of tightly packed nanoparticles. These structures provide an ideal foundation for carbon-coated metal oxide hollow materials. As a lithium-ion battery anode, this material exhibited high initial discharge capacity (915 mA·h·g-1, Figure 4g), excellent rate capability (361 mA·h·g-1 at 5000 mA·g-1, Figure 4h), and outstanding long-term cycling stability (472 mA·h·g-1 retained after 700 cycles at 2000 mA·g-1, exceeding 100% retention). The unique hollow structure combined with the carbon coating effectively shortens ion diffusion paths, enhances electrical conductivity, and buffers volume changes during cycling [82].
2.3.3 Kirkendall Effect
The Kirkendall effect describes the phenomenon where an imbalance in the mutual diffusion rates of two substances across an interface leads to vacancy formation. Specifically, the preferential outward diffusion of faster-migrating metal atoms creates vacancies that slower-diffusing atoms cannot adequately replenish. This net vacancy flux ultimately results in pore formation and coalescence into hollow structures within the material. This mechanism provides a fundamental theoretical basis for the template-free synthesis of nanoscale hollow structures. Such synthesis obviates the need for pre-designed templates, instead achieving directed cavity formation solely through the control of diffusion kinetics. Crucially, the approach is applicable to diverse material systems, including metals, oxides, and sulfides [83].
Chu et al. successfully synthesized hollow NiO nanoparticles via a Kirkendall-effect-driven template-free method [84]. Their approach involved: i) Precursor synthesis: Preparation of Ni/C nanocomposites using a molten salt calcination method (Figure 5a). ii) Oxidation and hollowing: Secondary calcination in air, where Ni nanoparticles act as sacrificial precursors. During oxidation, Ni2+ ions diffuse outward significantly faster than O2- ions diffuse inward (the nanoscale Kirkendall effect). This asymmetric diffusion creates a concentration gradient between the metal core and the forming oxide shell, driving vacancy accumulation and the eventual formation of a central void.
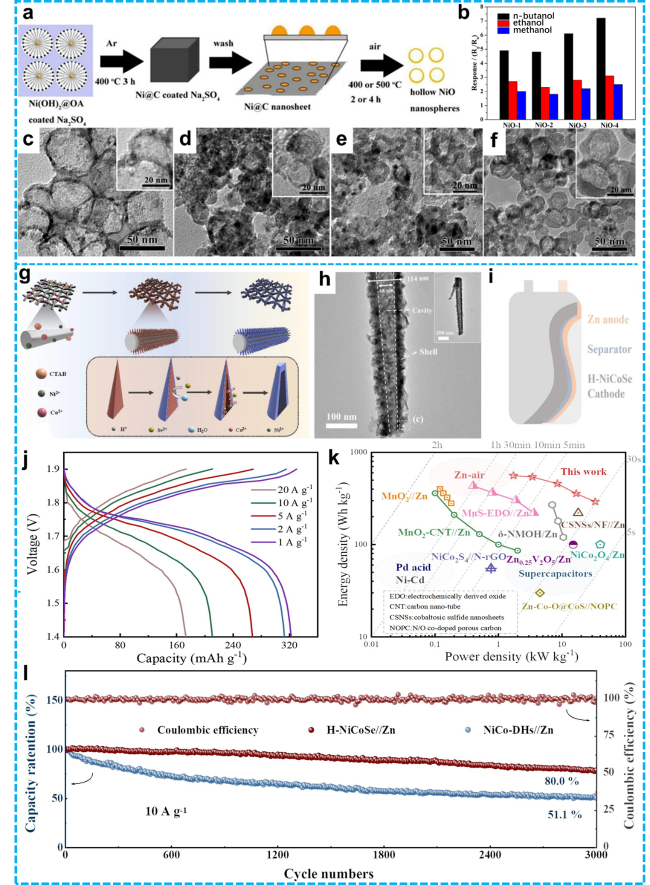
Figure 5 a) Schematic diagram of hollow NiO nanosphere synthesis procedures; b) Selectivity of four NiO-based sensors toward 800 ppm target gases at 240°C; TEM images of (c) NiO-1; (d) NiO-2; (e) NiO-3; (f) NiO-4. The inset images show cross-sectional TEM views of hollow NiO nanospheres [84]. Copyright 2019, Elsevier. g) Diagram depicting the synthesis route of H-NiCoSe@CC nanoarrays; h) TEM image of the prepared H-NiCoSe nanoarrays; i) Schematic representation of a flexible full battery using H-NiCoSe as the cathode and zinc metal as the anode; j) Galvanostatic charge-discharge (GCD) profiles of the H-NiCoSe//Zn battery at various current densities; k) Ragone plots for the H-NiCoSe//Zn battery; l) Cycling performance of the as-assembled H-NiCoSe//Zn and NiCo-DHs//Zn batteries at a current density of 10 A·g-1 [54]. Copyright 2023, Elsevier. |
Systematic variation of calcination temperature (400-500 ℃) and duration (2-4 h) enabled control over the crystallinity and morphology of the resulting hollow structures. Transmission electron microscopy (TEM) analysis revealed the significant influence of heat treatment parameters: NiO-1 (Figure 5c): Exhibited polydisperse hollow spheres (~40 nm avg. diameter) with a wide size distribution. NiO-2 (Figure 5d) and NiO-3 (Figure 5e): Evolved into more uniform spherical hollow structures (~20 nm diameter). Their shells comprised disordered stacks of 10-15 nm nanoparticles, creating a porous assembly that substantially increased the specific surface area. NiO-4 (Figure 5f): Displayed highly symmetrical hemispherical hollow cavities (consistent ~20 nm diameter). Multi-angle TEM confirmed a preferred orientation arrangement of the shell nanoparticles.
Notably, the NiO-4 hollow structure demonstrated excellent gas sensing performance at 240 °C, exhibiting high sensitivity (Rg/Ra = 9.0) and selectivity towards 1000 ppm n-butanol (Figure 5b). This performance is attributed to the thin, porous outer shell facilitating efficient gas diffusion and electron transport, highlighting a novel design strategy for functional hollow nanomaterials [84].
Gao et al. developed a related template-free strategy, leveraging the Kirkendall effect to fabricate hollow bimetallic selenide electrodes [54]. Their methodology comprised: i) Precursor fabrication: Growth of NiCo bimetallic hydroxide (NiCo-DHs) nanoneedle arrays on carbon cloth (CC) via hydrothermal synthesis (Figure 5g). ii) Selenidation and hollowing: Reaction with H2Se gas, where surface hydroxides react to form an initial Ni3Se4/CoSe2 shell layer. Crucially, asymmetric diffusion occurs: Se2- anions diffuse inward to bind metal cations, while Ni2+/Co2+ cations migrate outward to form new selenide phases at the surface. This preferential loss of internal metal ions due to their faster outward diffusion drives vacancy supersaturation and cavity formation within the nanostructure (Figure 5h).
This ion-diffusion-rate-based Kirkendall effect successfully yielded self-supporting hollow bimetallic selenides (H-NiCoSe/CC) directly on carbon cloth, serving as cathodes for aqueous zinc-based batteries (AZBBs) (Figure 5i). The template-free, asymmetric diffusion strategy avoids the cumbersome steps of traditional templating methods and eliminates "dead volume" issues associated with polymeric binders. The H-NiCoSe/CC cathode exhibited exceptional electrochemical performance: i) High specific capacities: 405.8 mA·h·g-1 at 1 A·g-1; 300.2 mA·h·g-1 at 30 A·g-1 (Figure 5j). ii) High energy density in a flexible full cell: 557.0 Wh·kg-1 (Figure 5k). iii) Excellent cycling stability: 80% capacity retention after 3, 000 cycles (Figure 5l). This work presents a viable new strategy for designing high-performance energy storage devices [54].
2.3.4 Ion Exchange
Ion exchange represents a pivotal strategy for synthesizing hollow nanostructures. Its fundamental mechanism relies on the directed replacement of lattice ions in a solid precursor with ions from the solution phase, inducing controlled reconstruction of composition and morphology. This process leverages the chemical potential gradient between specific metal cations or anions within the precursor and the introduced ionic species in the reaction medium. The resulting diffusion-controlled ion transport facilitates compositional transformation and structural evolution, culminating in hollow architectures [87].
Li et al. utilized a template-free methodology to synthesize hollow microplate-like CoMoO4 structures via ion exchange [88]. Initially, cobalt-based metal-organic framework (Co-MOF) microplate arrays were fabricated on a nickel foam (NF) substrate solvothermally, serving as the precursor. Subsequent hydrothermal ion exchange involved the gradual replacement of BDC2+ organic ligands within the Co-MOF by MoO42- anions from solution. During this exchange, MoO42- combined with Co2+ to form an ultrathin CoMoO4 nanolayer shell, while the Co-MOF core was concurrently consumed. This process yielded ultrathin nanolayer-assembled hollow microplate arrays (CoMoO4-HMPA/NF) (Figure 6a, b). Electrochemical characterization revealed that the CoMoO4-HMPA/NF electrode exhibited ultra-high specific capacitance (12.2 F·cm-2, 6120 C·cm-2 at 2 mA·cm-2), excellent rate performance (82.2% retention at 50 mA·cm-2), and cycling stability (90.5% capacity retention after 5000 cycles) (Figure 6c, d). Asymmetric supercapacitors (ASCs) assembled using this electrode delivered an energy density of 0.321 mWh·cm-2 (Figure 6e) and exceptional cycling stability (96.0% capacity retention after 5000 cycles) (Figure 6f), demonstrated by successfully powering a blue LED, underscoring its practical potential [88].
Xu et al. synthesized multicomponent CoSe2/FeSe2 double-shell hollow nanocubes (DS-HNCs) as an efficient catalyst (Figure 6g-i) [56]. Solid-state cobalt precursor nanocubes served as templates. Room-temperature ligand exchange first produced a mesoporous double-shell hollow intermediate, Co2[Fe (CN)6]. Subsequent selenium ion exchange yielded the target CoSe2/FeSe2 DS-HNCs. The synergistic effect between the unique double-shell hollow nanostructure and high-oxidation-state Co3+ species endowed the material with exceptional oxygen evolution reaction (OER) performance in 1M KOH. Notably, it achieved a current density of 10 mA·cm-2 at a low overpotential of 240 mV (Figure 6j) and demonstrated electrochemical durability exceeding 50 hours (Figure 6k), significantly surpassing single-component selenides and some precious-metal benchmarks. This work provides a novel strategy for designing multicomponent, precious-metal-free electrocatalysts and highlights the critical roles of double-shell hollow architectures and high-oxidation-state species in enhancing OER kinetics and stability [56].
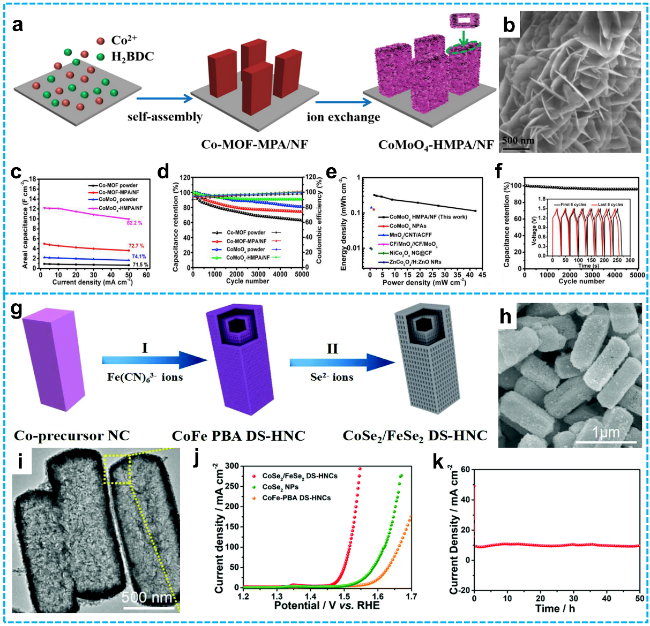
Figure 6 a) Schematic illustration of the synthesis process for CoMoO4-HMPA/NF composite; b) SEM images of CoMoO4-HMPA/NF; c) Areal capacitances versus current densities; d) Cycling performance and coulombic efficiency comparisons among CoMoO4-HMPA/NF, CoMoO4 powder, Co-MOF-MPA/NF, and Co-MOF powder; e) Energy and power density plots of the CoMoO4-HMPA/NF//AC asymmetric supercapacitor (ASC), alongside literature data; f) Cycling stability of the CoMoO4-HMPA/NF//AC ASC device [88]. Copyright 2019, Elsevier. g) Schematic diagram depicting the stepwise ion exchange strategy for synthesizing CoSe2/FeSe2 DS-HNCs; h) SEM, i) TEM images of the as-obtained CoSe2/FeSe2 DS-HNCs; j) LSV curves for OER testing of CoSe2/FeSe2 DS-HNCs, CoSe2 NPs and CoFe-PBA DS-HNCs; k) Chronoamperometric response of CoSe2/FeSe2 DS-HNCs at a constant potential of 1.47 V [56]. Copyright 2019, Royal Society of Chemistry. |
Beyond binary systems, more intricate multishell structures are accessible through ion exchange strategies. Guan et al. demonstrated this using a stepwise approach [89]. Onion-like Co3O4 served as the precursor. An initial anion exchange reaction converted it into onion-like Co4S3. A subsequent cation exchange reaction then yielded onion-like hollow-structured nickel-cobalt sulfide (NiCo2S4) particles. When evaluated as battery electrodes, these particles exhibited high specific capacitance (1016 F·g-1 at 2 A·g-1) and excellent cycling stability (87% capacity retention after 10, 000 cycles). Hybrid supercapacitors (HSCs) constructed with NiCo2S4 as the positive electrode and activated carbon as the negative electrode delivered an energy density of 42.7 Wh·k·g-1 and outstanding cycling stability (only 8% capacity degradation after 10, 000 cycles). This performance is attributed to the complex multishell hollow architecture, coupled with the high specific surface area and conductive active sites provided by the nickel-cobalt composite [89].
2.3.5 Thermally Induced Matter Repositioning
Thermally induced material repositioning (TIMR) represents a versatile and directed synthesis strategy for hollow structures, exploiting the controlled non-equilibrium shrinkage behavior of materials during high-temperature processing [90]. The core mechanism arises from temperature gradients generated during the thermal decomposition of precursor components, which drive directional mass transport. Specifically, when metal-organic or inorganic composite precursors undergo heating, decomposition of organic/inorganic constituents releases gaseous products. An initial metal oxide shell forms, constraining contraction of the outer region, while the incompletely decomposed inner core experiences heterogeneous shrinkage under continued thermal exposure. This differential shrinkage ultimately leads to shell detachment, forming multi-shell architectures.
A defining characteristic of this approach is the utilization of precursors with uniformly distributed metal species within a thermally decomposable organic matrix. Crucially, shell layer number and spacing can be precisely modulated through parameters such as heating rate and precursor composition, eliminating the requirement for templating agents. This strategy demonstrates particular efficacy for synthesizing complex hollow multi-metal oxides [91].
Wang et al. employed quasi-hollow MnCo-glycolate precursors via air annealing to synthesize mesoporous hollow MnCo2O4 (MCO-II) [92]. Subsequent compositing with graphene oxide (GO) and argon reduction yielded a 3D sandwich-like graphene nanocomposite (MCO-27.2G) featuring double-shell hollow MnCo2O4 spheres and a reduced graphene oxide (rGO) network (Figure 7a-c). This architecture delivered exceptional performance as a lithium-ion battery anode: a capacity retention of 703 mAh·g-1 (80%) after 100 cycles at 200 mA·g-1 (Figure 7e), and a capacity of 538 mAh·g-1 at 1000 mA·g-1 (Figure 7d). These advantages are attributed to the volume buffering effect of the double-shell structure and the conductive support synergy of the rGO network [93].
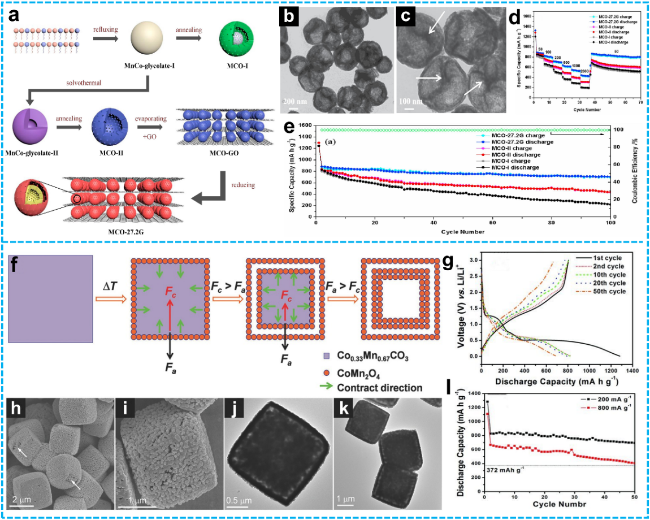
Figure 7 a) Schematic illustration of the typical synthesis routes for yolk-shell MCO-I spheres, mesoporous hollow MCO-II spheres, and MCO-27.2G nanocomposite; b-c) TEM images of mesoporous hollow MCO-II spheres; d) Rate capability of yolk-shell MCO-I spheres, mesoporous hollow MCO-II spheres, and MCO-27.2G nanocomposite electrodes at current densities ranging from 50 to 2000 $mA \cdot g^{-1}$; e) Cycling performance at 200 $mA \cdot g^{-1}$[93]. Copyright 2018, Elsevier. f) Schematic diagram of the synthesis of double-shelled CoMn2O4 hollow microcubes; g) discharge/charge profiles; FESEM (h-i), TEM (j-k) images of double-shelled CoMn2O4 hollow microcubes; l) Cycling stability of double-shelled CoMn2O4 hollow microcubes in the voltage window of 0.01-3.0 V vs. Li/Li⁺ at current densities of 200 and 800 $mA \cdot g^{-1}$ [94]. Copyright 2011, John Wiley and Sons. |
Zhou et al. leveraged differential core-shell shrinkage during thermal decomposition of Co0.33Mn0.67CO3 microcubes to synthesize double-shelled CoMn2O4 hollow microboxes (Figure 7f, h-k) [11]. The resultant material exhibited a high initial discharge capacity (1282 mAh·g-1, Figure 7g) and superior cycling stability (624 mAh·g-1 retention after 50 cycles at 200 mA·g-1, Figure 7l). Performance enhancements stem from the nanostructure-promoted conversion reactions and the hollow framework's capacity to accommodate volume changes [94].
Zhao et al. synthesized porous Ni-Co-Mn oxide prisms via coprecipitation and calcination exhibited a high specific surface area (96.53 m2·g-1) and mesoporous structure (average pore size: 18.37 nm) [95]. As a supercapacitor electrode, it achieved a high specific capacitance (1623.5 F·g-1 at 1.0 A·g-1) and excellent cycling stability (97.8% retention after 5000 cycles). Furthermore, flexible solid-state asymmetric supercapacitors incorporating this material demonstrated a volumetric energy density of 0.885 mWh·cm-3 and power density of 48.9 mW·cm-3, alongside robust mechanical stability under bending.
Du et al. utilized pure and PdO-loaded double-shelled ZnSnO3 to form hollow microspheres via coprecipitation and calcination. Characterization confirmed that the 4 wt% PdO-loaded sensor exhibited a high response (30.8 to 100 ppm n-propanol), rapid response/recovery kinetics (1s/25s) at 140°C, excellent repeatability, and long-term stability. This superior sensing performance originates from the unique double-shell morphology and the combined catalytic/sensing functionalities of PdO [96].
Although the hard-templating method excels in controlling structural morphology and shell uniformity, its multi-step synthesis process—including template preparation, functionalization, deposition, and removal—significantly increases process complexity and cost. Moreover, template removal often involves strong acids (e.g., HF) or high-temperature calcination, which are not only hazardous but may also damage the shell structure or introduce impurities. Despite its applicability to various materials (e.g., SiO2, PS), this method exhibits notable limitations in terms of sustainability and large-scale production. The soft-templating approach, leveraging self-assembly behavior, offers excellent control over pore structures, particularly for hierarchical pores and flexible frameworks. Yet the templates used (e.g., surfactants, micelles) often exhibit poor stability under reaction conditions and are susceptible to disruption by introduced precursors, limiting their applicability in novel material systems such as multicomponent or heterogeneous structures. Although breakthroughs have been made via cooperative assembly strategies, the generalizability and reproducibility of this method remain challenging. Template-free methods are favored for their simplicity and environmental benefits by avoiding template use, yet each variant has significant limitations: Selective etching highly depends on the chemical heterogeneity within the precursor. If the stability gradient is insufficient, uniform etching becomes difficult, potentially leading to structural irregularity or collapse. Ostwald ripening can facilitate structural evolution from solid to multi-shelled architectures, but requires extended reaction times (up to tens of hours) and is highly sensitive to parameters such as temperature and concentration, making control challenging. The Kirkendall effect, which utilizes diffusion differences to form cavities, is applicable to diverse material systems. However, it requires a significant difference in diffusion rates between components; otherwise, ideal hollow structures may not form, and diffusion asymmetry can cause shell fracture. Ion exchange can construct hollow structures in multinary metal compounds, but the process often induces structural reorganization or collapse, especially when large ion size differences compromise mechanical stability. Thermally induced mass relocation can form multi-shell structures through uneven shrinkage during heat treatment. However, high temperatures may cause particle sintering, pore closure, or reduction of active sites, adversely affecting the final performance.
Current synthetic methods for hollow structures each possess distinct features, while also exhibiting inherent limitations. Future research should focus on developing green, highly efficient, and precisely controllable synthesis strategies integrating in situ characterization techniques with computational simulations to drive the evolution of this strategy towards truly precise and predictable synthesis to achieve the ultimate goal of facilitating their more extensive utilization in various domains, including catalysis, energy, and sensing.
3 Energy Storage and Conversion Applications
Hollow-structured materials represent a significant advancement in energy storage and conversion technologies due to their inherent structural advantages. Their three-dimensional frameworks integrate high specific surface area, tunable porosity, and low density, establishing an exceptional structural paradigm for efficient energy management.
Table 2 Comparison of hollow structure preparation methods. |
| Method type | Method name | Advantage | Disadvantage | Typical application areas |
|---|---|---|---|---|
| Hard template method | Hard template | Controllable structure, uniform morphology, wide applicability, and good repeatability | Complicated steps, complex template preparation and removal, possible introduction of impurities, high cost | Catalysis, drug delivery, energy storage |
| Soft template method | Soft template | Adjustable pore structure, suitable for complex multi-level porous materials, mild conditions | Low template stability, sensitivity to reaction conditions, and difficulty in use in multi-component systems | Photocatalysis, battery electrodes, adsorbent materials |
| Template-free method | Selective etching | No need for templates, simple steps, and the ability to prepare multi shell structures | Dependent on the chemical differences of precursors and difficult to control | Catalysis, sensors |
| Ostwald ripening | Template required, controllable number of shell layers, suitable for various metal oxides | Long reaction time and complex kinetic control | Gas sensing, biocatalysis, batteries | |
| Kirkendall effect | Suitable for various materials (metals, oxides, sulfides, etc.), controllable cavity formation | High requirements for diffusion rate and possible formation of non ideal structures | Gas sensing, electrochemical energy storage | |
| Ion exchange | Capable of preparing multi-component compounds with diverse structures, suitable for complex hollow structures | The ion exchange process is difficult to control and may lead to structural collapse | Supercapacitors, electrocatalysts | |
| Thermally induced matter repositioning | Capable of preparing multi shell hollow structures, template free, suitable for multi metal oxides | High temperature treatment may lead to sintering or structural damage | Lithium-ion batteries, supercapacitors |
In energy storage systems, hollow architectures effectively mitigate electrode volume expansion during cycling, substantially enhancing structural integrity and extending cycle life of batteries (lithium-ion/sodium-ion) [97]. Concurrently, the internal void space accommodates greater active material loading, while shortened ion diffusion pathways improve reaction kinetics and energy density [98]. The interconnected hollow channels facilitate rapid electrolyte ion transport in supercapacitors. Combined with abundant electrochemically accessible surface sites, this enables the delivery of exceptionally high power density [99].
In energy conversion applications, the confined interior spaces enable precise modulation of catalytic reaction pathways. For instance, in electrocatalytic processes (e.g., oxygen reduction reaction (ORR) and hydrogen evolution reaction (HER)), thin walls maximize active site exposure, optimizing reactant adsorption and product desorption. This enhances energy conversion efficiency in devices such as fuel cells and water electrolyzers [100]. Furthermore, the multifunctionality achievable through composite hollow structures synergistically enhances electrical conductivity and chemical stability, providing a robust platform for designing high-durability electrocatalysts and electrodes [101].
These collective attributes position hollow-structured materials as a pivotal strategy for overcoming the intrinsic limitations of conventional energy materials, demonstrating considerable potential for advancing next-generation energy storage devices and renewable energy conversion technologies.
3.1 Energy Storage
3.1.1 Lithium-ion Batteries
Lithium-ion batteries (LIBs) represent highly efficient electrochemical energy storage systems. Their operation relies on the reversible insertion and extraction of lithium ions between a cathode and an anode, facilitated by an ion-conducting electrolyte [102]. Key advantages include high energy density, lightweight design, and environmental friendliness, establishing LIBs as the dominant power source for portable electronics and a critical technology for electric vehicles and smart grids [103]. However, the energy density of conventional LIB systems is approaching theoretical limits, insufficient for demanding high-range applications [104]. Concurrently, high-capacity anode materials (e.g., silicon, tin, transition metal oxides - TMOs) undergo substantial volume fluctuations during cycling. This induces material pulverization, interfacial instability, and rapid capacity degradation, presenting critical bottlenecks for practical implementation [105,106].
Hollow-structured materials offer a promising approach to mitigate these challenges. Their internal voids effectively accommodate mechanical stresses from volume expansion, minimize dimensional changes, prevent electrode fracturing, and inhibit agglomeration of nanostructured electroactive materials. Furthermore, thin shells shorten lithium-ion diffusion paths, enhancing reaction kinetics, while porous shells increase active site exposure and improve electrolyte penetration efficiency [107].
Huang et al. synthesized ultra-fine Co3O4 hollow nanoparticles (< 20 nm) uniformly embedded within a mesoporous carbon nanowall using a MOF-template strategy involving chemical etching and coordination bonding, followed by a two-step annealing process (Figure 8a-b) [110]. This structure confers multiple benefits: i) Internal cavities buffer volume expansion during lithiation/delithiation, preventing structural collapse. ii) Nanoscale dimensions and homogeneous dispersion increase active interfacial sites and shorten Li+ diffusion paths, enabling a specific capacity of 420 mA·h·g-1 at 5 A·g-1 (Figure 8c). The porous carbon framework enhances electron transport, facilitates electrolyte infiltration/ion migration, and physically confines Co3O4 nanoparticles, suppressing agglomeration and maintaining integrity. Synergistically, this yielded a high specific capacity (1120 mA·h·g-1 at 0.2 A·g-1 over 100 cycles, Figure 8d) and excellent rate capability (reversible capacity fluctuation rate < 63% between 0.1-5 A·g-1), significantly outperforming pure Co3O4 nanoboxes (48% capacity retention after 300 cycles).
Kang et al. developed Co3O4/CeO2 heterostructures via one-step microwave synthesis of MOF precursors (Figure 8f-g) to address the dual challenges of large volume changes and low intrinsic conductivity in Co3O4 [111]. Optimizing the Co2+/Ce3+ molar ratio revealed the 5 Co3O4/CeO2 composite (5:1 Co/Ce) exhibited superior performance: i) A reversible specific capacity of 1131.2 mA·h·g-1 after 100 cycles at 100 mA·g-1 (Figure 8i), markedly higher than single-phase Co3O4 (538.6 mA·h·g-1). ii) High-rate capacity retention of 835.3 mA·h·g-1 at 2000 mA·g-1 (Figure 8h). The enhancement stems from CeO2 synergy (Figure 8e): acting as an inert support buffering Co3O4 volume expansion, forming interfaces that shorten Li+ diffusion paths and enhance conductivity, and the MOF-derived mesoporous structure improving electrolyte access/active site exposure. Interfacial capacitive contributions further boost reversible capacity. This work provides novel design insights for rare-earth-modified heterostructures.
Tabassum et al. reported a generalized pyrolysis-oxidation method (Figure 8j) to synthesize core-shell hollow TMO nanoparticles (e.g., CoO, Ni2O3, Mn3O4) encapsulated within boron/nitrogen co-doped graphitic nanotubes (BNG) as Core-Shell TMO@BNG Nanotubes (Figure 8k) [109]. Designed as high-performance LIB anodes, the TMO@BNG leverages structural synergies. Notably, CoO@BNG demonstrated rate capabilities of 1451, 1215, 1008, 670, 631, 520, and 247 mA·h·g-1 from 0.1 to 3 A·g-1 (Figure 8l); exceptional cyclic stability (96% capacity retention after 480 cycles at 1.75 A·g-1). This performance arises from the hollow TMO buffering volume expansion and the BNG providing high conductivity, large surface area for electrolyte penetration, and SEI film stabilization (Figure 8m).
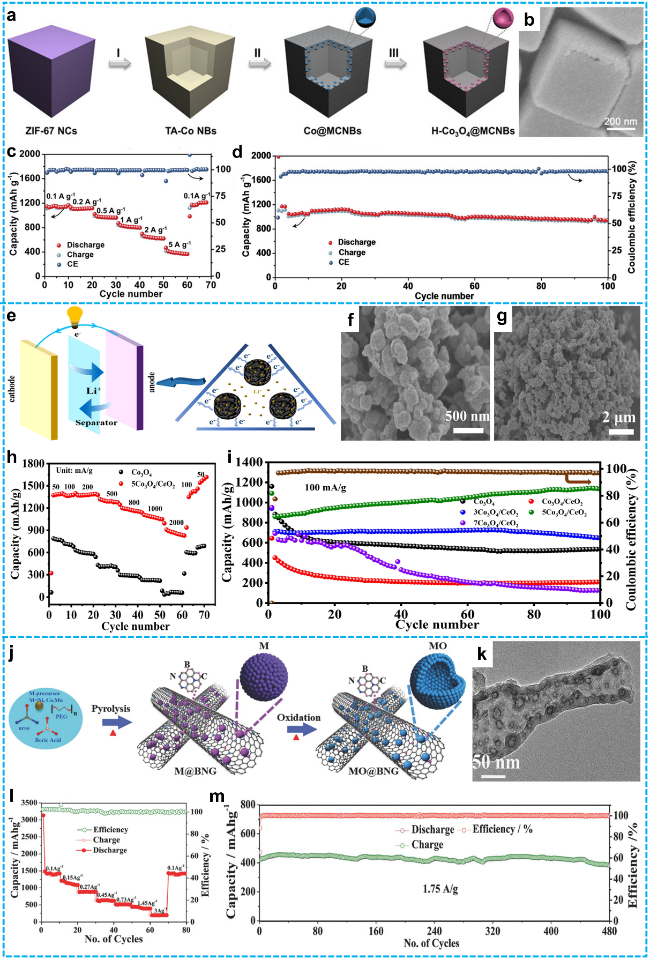
Figure 8 a) Schematic illustration of the formation process of H-Co3O4@MCNBs; b) FESEM images of H-Co3O4@MCNBs; c) Rate capability and coulombic efficiency profiles at different current densities; d) Cycling stability at 0.2 A·g-1 and the associated Coulombic efficiency [110]. Copyright 2020, John Wiley and Sons. e) Schematic of a lithium-ion battery; Li+ shuttles between cathode and anode via separator; Left: overall battery structure with electron flow powering a device; Right: enlarged view of anode showing Li+ and e- movement, key for anode electrochemical reactions during charge-discharge; f-g) SEM images of 5 Co3O4/CeO2; h) rate performance of Co3O4 and 5 Co3O4/CeO2; i) Cycling performance of as-prepared samples at 100 mA·g-1 [111]. Copyright 2021, Elsevier. j) Synthesis schematic of MO@BNG (MO: CoO, Ni2O3, Mn3O4) nanotubes; k) TEM image of CoO@BNG nanotubes of hollow CoO nanoparticle; l) Storage capacity of CoO@BNG nanotubes at various current densities; m) Long-term cycling stability of CoO@BNG at a high current density of 1.75 A·g-1 [109]. Copyright 2018, John Wiley and Sons. |
Beyond TMOs, silicon-based materials are highly promising anodes due to an exceptional theoretical capacity (~4200 mA·h·g-1), nearly tenfold higher than graphite. However, severe lithiation-induced volume expansion causes pulverization, electrode collapse, conductive network failure, exacerbated interfacial reactions, and unstable SEI growth [112]. Nanostructuring, particularly hollow structures (porous Si, core-shell, yolk-shell), effectively buffers stress and accommodates expansion. Nevertheless, inherent low particle density and potential pore collapse during electrode calendering or cycling can diminish the benefits of hollow designs. Addressing this, the Li team engineered a high-density, crack-resistant Si-C microparticle [113]. Its key feature is a dual-layer carbon matrix: i) An inner porous carbon layer (mesopore volume 62.53 m2·g-1) buffers Si expansion. ii) An outer dense carbon layer (specific surface area 3.58 m2·g-1) prevents electrolyte penetration. This “in-situ pore generation” design achieves a high tap density (0.86 g·cm-3, 473% improvement over traditional hollow structures), 96.2% capacity retention after 200 cycles, and minimal electrode expansion (18.6% vs. ~50% industry standard). Full cells pairing this anode with LiFePO4 exhibit an 18.3% increase in energy density compared to graphite-based cells, demonstrating significant progress towards high-energy-density batteries via optimized hollow structure engineering.
3.1.2 Lithium-Sulfur Batteries
Lithium-sulfur (Li-S) batteries represent a promising next-generation high-energy-density storage technology. Their core advantage lies in the sulfur cathode's exceptionally high theoretical specific capacity (1, 675 mA·h·g-1), coupled with abundant raw materials, low cost, and environmental benignity, positioning them as potential replacements for conventional lithium-ion batteries (LIBs). However, significant challenges impede their practical implementation: i) The inherently insulating properties of sulfur and its discharge products (Li2S2/Li2S) result in poor electrical conductivity and severely limit the utilization of the active material [114]. ii) Soluble lithium polysulfide intermediates (LiPSs, Li2Sn, 4≤n≤8), generated during the redox processes, shuttle between the electrodes, leading to irreversible active material loss, rapid capacity fade, and poor cycling stability. iii) The substantial volumetric expansion (~80%) occurring during repeated lithiation/delithiation cycles induces significant mechanical stress within the electrode, resulting in structural degradation [115].
Hollow carbon nanostructures (HCNs) represent a promising mitigation strategy, leveraging their inherent structural advantages as high surface area, tunable porosity, and mechanical resilience, which providing a versatile platform for addressing these challenges. The high void volume enables efficient encapsulation of sulfur within its internal cavity. Optimized pore structures accommodate volume changes during cycling via a buffering effect. The carbon shell functions as a physical barrier, effectively suppressing the dissolution and migration of lithium polysulfides (LiPS), thereby mitigating the shuttle effect. Enhanced kinetics arise from the mesoporous channels facilitating Li⁺ diffusion and improving the conductivity of the encapsulated sulfur, thus boosting electrochemical utilization efficiency [116].
Pioneered by the Nazar group's demonstration of LiPS confinement using ordered mesoporous carbon (CMK-3) [117], structural engineering of carbon hosts has become central to Li-S research. This field has diversified into a multi-dimensional innovation system. Hollow carbon nanospheres encapsulate sulfur within their sealed cavities, effectively confining sulfur and mitigating its volume changes during cycling [118]. Hierarchical carbon nanocages incorporate three-dimensionally interconnected porous structures, facilitating rapid ion diffusion and electrolyte penetration [119]. Aligned carbon nanotube (CNT) arrays utilize their inherent axial electrical conductivity to significantly enhance the overall electrode conductivity [120]. Micro/mesoporous carbons exploit the synergistic effects of their multi-scale porosity to achieve high sulfur loading and retention in high-capacity cathodes [116]. Porous graphene facilitates the design of ultra-thin and potentially flexible electrodes due to its extended single-atom-layer structure [121].
Through pore topology optimization and dimensional control, these materials provide synergistic solutions to sulfur's low conductivity and LiPS shuttling. Despite their benefits, non-polar carbon materials exhibit insufficient chemical interactions with polar LiPSs, limiting their confinement efficacy primarily to physical barriers, effective mainly in short-term cycling. To enhance LiPS anchoring for extended cycle life, two primary strategies are widely pursued [122]:
Heteroatom-doped carbon matrices: Introducing electron-donating heteroatoms (e.g., N, O, S) significantly enhances LiPS chemisorption via dipole-dipole coupling with Li+. For instance, Zhang et al. synthesized hydrophilic graphene@graphite-phase nitrogen-doped carbon (GCN) nanosheets with a hierarchical porous structure (macropores ~60 nm, mesopores ~3 nm) using oil-phase microemulsion templating (Figure 9a). Sulfur (82 wt%) was in situ encapsulated within the GCN pore walls (Figure 9d, e). Pyridinic N moieties within the GCN/g-C3N4 matrix engage in Lewis acid-base interactions with Li atoms in Li2Sn, providing strong chemisorption to suppress dissolution [123,124]. Concurrently, the graphene framework ensures high conductivity and mechanical integrity. This “physical-chemical dual confinement” design buffers volume expansion via macropores while enhancing anchoring via mesopores and N-doping. Consequently, the S/GCN cathode delivered 612 mA·h·g-1 at 10 C (Figure 9b), retained 86% capacity after 800 cycles at 0.3 C (decay rate: 0.017% per cycle; Figure 9f), and exhibited near-100% coulombic efficiency with minimal capacity decay across varied rates, demonstrating exceptional reversibility and rate capability (Figure 9c) [125].
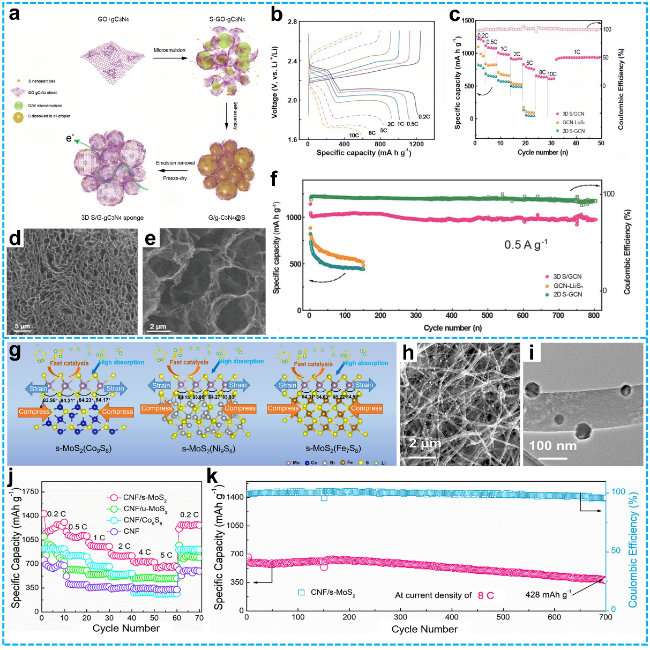
Figure 9 a) Schematic diagram of the preparation process for S/GCN hybrid sponges; b) Galvanostatic charge-discharge (GCD) voltage profiles of the S/GCN cathode at various charge-discharge rates; c) Rate performance of S/GCN, GCN-Li2Sn, and S-GCN electrodes (Coulombic efficiency data correspond to the S/GCN cathode); d) Cross-sectional morphology and e) high-resolution SEM image of S/GCN; f) Long-term cycling stability of S/GCN, GCN-Li2Sn, and S-GCN cathodes at a low current density of 0.5 A·g-1 (0.3 C) [125]. Copyright 2018, John Wiley and Sons. g) Ball-and-stick models depicting strained MoS2 adsorbed on Co9S8, Ni9S8, and Fe7S8 surfaces; h) SEM and i) low-magnification TEM images of CNF/s-MoS2(Co9S8) composites; j) Rate performance of the cells from 0.2 C to 5 C; k) Long-term cycling stability of the CNF/s-MoS2 electrode over 700 cycles at 8 C [130]. Copyright 2022, Elsevier. |
Polar hosts based on transition metal compounds: Materials like metal sulfides [126], oxides [127], and MXenes [128] offer enhanced LiPS fixation through Lewis acid-base coordination, polar interactions, and sulfur-chain bridging. Molybdenum disulfide (MoSx) distinguishes itself due to its layered structure, high intrinsic conductivity (10-100 S/cm), rapid Li+ diffusion (DLi+≈10−8cm2/s), and strong LiPS affinity (adsorption energy > 2.5 eV) [129]. Zhang et al. employed strain engineering to modulate MoS2 surface structure, synthesizing core-shell nanoparticles (metal sulfide core/strained MoS2 (s-MoS2) shell) via electrospinning (Figures 9h, i). Strain enlarged the S-Mo-S bond angle and shifted the d-band center closer to the Fermi level, boosting both LiPS adsorption and catalytic conversion kinetics (Figure 9g). The resulting CNF/s-MoS2 cathodes achieved high reversible capacities (1290 mA·h·g-1 at 0.2 C; 657 mA·h·g-1 at 5 C; Figure 9j) and outstanding stability (0.05% decay per cycle after 700 cycles at 8 C; Figure 9k), exemplifying the potential of strain-engineered core-shell designs [130].
3.1.3 Supercapacitors
Supercapacitors as an emerging class of electrochemical energy storage systems, exhibit substantial promise due to their high power density, rapid charge-discharge kinetics, and exceptional cycle stability [131-137]. Crucially, they bridge the performance gap between traditional capacitors and batteries, achieving energy density enhancements spanning multiple orders of magnitude, which makes them particularly suitable for applications requiring short-term, high-power output, such as electric vehicle start-stop systems and grid frequency regulation [132]. However, limitations persist, primarily low energy density (typically < 10 Wh·kg-1) and insufficient utilization of active materials, hindering broader application.
Hollow nanostructured materials present a promising strategy to address these challenges. Their unique structural design offers key advantages: i) Enhanced accessible reaction sites promote higher energy density; ii) Porous shell structures facilitate efficient electrolyte penetration and significantly shorten ion diffusion pathways, leading to elevated power density. Critically, in complex multi-shelled architectures, the outer shell represents as a protective barrier against electrochemical degradation and mechanical attrition of inner components, ensuring superior cycling stability through structural reinforcement [10].
Supercapacitors are categorized into three primary types based on energy storage mechanisms : electric double-layer capacitors (EDLCs) relying on interfacial charge separation, pseudocapacitors utilizing surface Faradaic redox reactions, and hybrid devices combining both mechanisms. Pseudocapacitors are distinguished from EDLCs by their Faradaic charge storage, which endows them with superior specific capacity and energy density [138]. Consequently, significant research focuses on transition metal oxide-based pseudocapacitive materials, such as NiO [139], Co3O4, and MnOx [140,141]. A fundamental limitation of these single-metal systems, however, is inadequate intrinsic electrical conductivity, resulting in compromised cyclic stability and rate capability.
To overcome this limitation, ternary metal oxides have emerged as a promising alternative, leveraging multi-metal synergistic effects, abundant active sites, and optimized charge transport properties [142,143]. Among these, NiCo2O4 and MnCo2O4 demonstrate significant potential. Researchers continuously optimize their electrochemical performance through innovative synthesis: Hao et al. synthesized eggshell-structured NiCo2O4 (Figure 10a), achieving a high specific capacitance of 835.7 F·g-1 at 0.5 A·g-1 (Figure 10b) and exceptional cycling stability (93% retention after 10, 000 cycles at 10 A·g-1; Figure 10c) [144]. Yang et al. developed a hollow NiCo2O4 architecture (Figure 10d), delivering 1229 F·g-1 at 1.0 A·g-1 and maintaining 83.6% capacity at 25 A·g-1 (Figure 10e) [145]. Similarly, MOF-templated MnCo2O4 nanocages (Figure 10f) exhibited a superior specific capacitance of 1763 F·g-1 and 95% retention after 4500 cycles (Figure 10g) [146]. These findings underscore the critical role of structural engineering, particularly hollow designs with tunable shell permeability and internal void space, in enhancing electrochemical performance [10,147 -150].
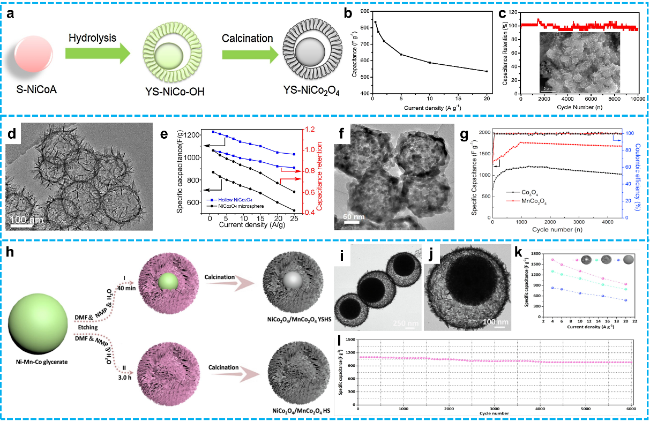
Figure 10 a) Diagram of the formation processes of YS-NiCo2O4; b) the capacitance and c) the cycle life at 10 A·g-1 and SEM image of YS-NiCo2O4 after 10, 000 cycles in inset [144]. Copyright 2018, Elsevier. d) TEM image of hollow NiCo2O4 nanospheres; e) The specific capacitances and capacitance retentions of the hollow NiCo2O4 nanospheres and NiCo2O4 microspheres [145]. Copyright 2018, Elsevier. f) TEM image of the as-obtained nanocage MnCo2O4; g) Coulombic efficiency of the two electrodes at the density of 1 A·g-1 [146]. Copyright 2017, Elsevier. h) Schematic illustration of the process for controllable synthesizing NiCo2O4/MnCo2O4 hollow structures; i-j) TEM images of NiCo2O4/MnCo2O4 YSHS;k) Specific capacitance of NiCo2O4/MnCo2O4 SS, HS and YSHS at current density 4.0-20 A·g-1; l) Cycling performance of NiCo2O4/MnCo2O4 YSHS at 15 A·g-1 over 6000 continuous charge-discharge [99]. Copyright 2023, Elsevier. |
Despite progress with single-phase hollow structures, the rational design of complex hybrid architectures remains underexplored. Addressing this, Shi et al. developed NiCo2O4/MnCo2O4 composite yolk-shell hollow spheres (YSHS) (Figure 10i, j) using nickel-manganese-cobalt glycerate templates combined with selective etching and pyrolysis (Figure 10h). This distinctive hierarchical architecture confers multifaceted advantages: an ultra-high specific capacitance of 1636 F·g-1 at 4.0 A·g-1; robust rate capability (57.4% retention at 20 A·g-1; Figure 10k); and exceptional cycling stability (only 10% decay after 6000 cycles at 15 A·g-1; Figure 10l). When integrated into solid-state asymmetric supercapacitors, the device delivered a high energy density of 62.8 Wh·kg-1 at 1650.4 W·kg-1, retaining 23.2 Wh·kg-1 even at an ultra-high power density of 12367.7 W·kg-1 [99]. This performance highlights its strong suitability for high-power electrochemical energy storage.
3.2 Energy Conversion
3.2.1 Electrocatalysis
Sustainable energy technologies have consistently constituted a critical research frontier. A central challenge in modern energy conversion systems is the rational design of highly efficient and durable electrocatalysts to drive critical electrochemical reactions [151-158], including the hydrogen evolution reaction (HER) [159], oxygen evolution reaction (OER) [160], oxygen reduction reaction (ORR) [161], and methanol oxidation reaction (MOR) [48].
Conventional precious metal electrocatalysts (e.g., Pt, Ru), while exhibiting excellent activity, suffer from scarcity and prohibitive costs, constraining large-scale deployment [162,163]. Furthermore, issues such as inadequate stability, limited mass transport efficiency, and insufficient active site exposure necessitate urgent resolution. Consequently, extensive research has focused on developing cost-effective transition metal-based alternatives, particularly transition metal oxides (TMOs) [101,164 -166]. Yet the widespread application of TMOs is hindered by their intrinsically poor electrical conductivity, which impedes efficient electron transport and significantly compromises electrocatalytic performance, notably in OER [101,166,167].
Hollow nanostructures represent a promising strategy to address key electrocatalyst limitations: i) Functional integration. Spatially segregated compartments within hierarchical hollow architectures facilitate the integration of otherwise incompatible catalytic functionalities or the encapsulation of distinct reactive species, enabling complex cascade reactions. ii) Enhanced selectivity. Tailoring shell pore architecture allows for molecular sieving, while modulating the chemical affinity at the shell interface can control reactant diffusion pathways, thereby systematically improving catalytic selectivity. iii) Maximized active sites: The inherent large specific surface area of hollow nanostructures significantly increases catalyst loading density and expands the accessible interface between active sites and reactant molecules. iv) Efficient mass transport: Ultrathin shell structures with optimized thickness promote rapid ion and molecular transport, minimizing diffusion resistance in electrochemical environments [168].
Rational optimization of TMO electronic properties is therefore critical for enhancing OER activity. Heteroatom doping or establishing strong coupling between active sites effectively modulates electronic configurations and activates catalytic centers, improving electronic transport and charge transfer kinetics [169].
Xu et al. synthesized mesoporous CoMn and CoMnSe nanobundles via hydrothermal methods (Figure 11a). Mn incorporation into cobalt oxides concurrently tunes electronic structure and induces nanobuckled morphology. The resulting self-supported Co1Mn1 bimetallic oxide achieves exceptional OER activity, requiring an ultralow overpotential of 221 mV at 10 mA·cm-2 (Figure 11b). The nanobranched Co1Mn1Se further exhibits superior HER performance (overpotential: 87.3 mV at 10 mA·cm-2; Figure 11c), surpassing most reported non-noble metal catalysts. Leveraging these complementary activities, a water electrolyzer employing Co1Mn1 oxide (anode) and Co1Mn1Se (cathode) attained 10 mA·cm-2 at 1.60 V in 1.0 M KOH (Figure 11d, e) with stable 36-hour operation (Figure 11f), demonstrating high-efficiency overall water splitting [167].
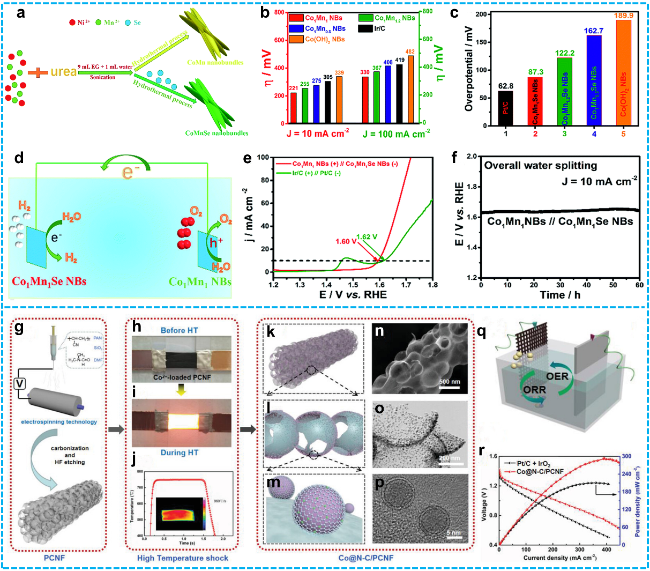
Fig 11. a) Schematic representation of the synthetic methodology for CoMn and CoMnSe nanobundles; b) Overpotential values at current densities of 10 and 100 mA·cm-2 and c) Overpotentials at a current density of 10 mA·cm-2 for Co1Mn1Se NBs, Co1Mn1.2Se NBs, Co1Mn0.8Se NBs, Pt/C, and Co(OH)2 NBs; d) Schematic diagram of the overall water electrolysis process; e) Polarization curves for the Co1Mn1 NBs (+)//Co1Mn1Se NB (−) electrode pair and the Ir/C (+)//Pt/C (−) pair in 1.0 M KOH solution at a scan rate of 5 mV·s-1; f) Continuous chronopotentiometry (CP) measurement of the Co1Mn1 NBs (+)//Co1Mn1Se NB (−) couple over 36 hours [167]. Copyright 2018, Royal Society of Chemistry. g) Schematic representation of the high-temperature (HT) shock synthesis of PCNF; h-i) Photographic sequences depicting the heating procedures employed in the fabrication of Co@N-C/PCNF; j) Temperature profile during the HT shock process, with an inset showing the temperature distribution map; k-m) Structural modeling of distinct components in Co@N-C/PCNF, accompanied by n) SEM, o) TEM, and p) HRTEM images that characterize the selected structural features of the Co@N-C/PCNF composite; q) Schematic illustration of the AZAB configuration; r) Corresponding discharge polarization curves and power density profiles [170]. Copyright 2023, John Wiley and Sons. |
In parallel, Lu’s team developed a bifunctional Co@N-C/PCNF electrocatalyst (i.e., Co nanoparticles encapsulated in N-doped hollow porous carbon nanofibers) via ultra-rapid high-temperature impact synthesis (Figures 11g-j). Synergy between Co-N-C active sites and the porous carbon framework (Figures 11k-p) confers outstanding bifunctionality: OER overpotential of 289 mV at 10 mA·cm-2 and ORR half-wave potential of 0.85 V. The Co-N-C moieties optimize adsorption/desorption kinetics and reduce activation barriers by modulating the local electronic environment. When deployed in aqueous zinc-air batteries (AZABs; Figure 11q), the catalyst delivers a peak power density of 292 mW·cm-2 (Figure 11r). Flexible AZABs incorporating this material successfully power wearable electronics, underscoring its practical utility in portable energy systems [170].
3.2.2 Photocatalysis
Photocatalysis represents an advanced oxidation process, has garnered significant research interest due to its inherent advantages of high-efficiency [171-176], cost-effectiveness, and minimal secondary pollution, which finds diverse applications, including hydrogen generation [177,178], CO2 photoreduction [179-183], heavy metal detoxification, biodegradation, and air purification.
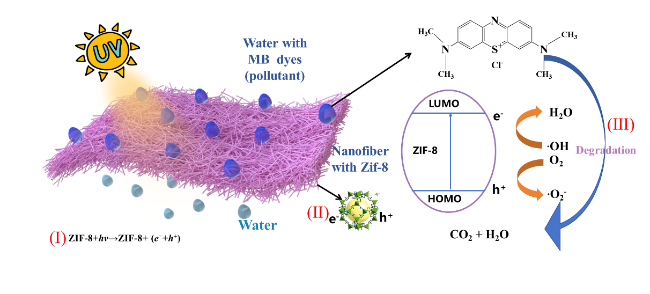
Scheme 4 Steps of the photocatalytic reaction process. (I) Light absorption generates electron-hole pairs; (II) Separation of excited charges and transfer of electrons and holes to the photocatalyst surface; (III) Utilization of surface charges for redox reactions. |
i) Light absorption: Photocatalysts absorb photons, promoting electrons from the valence band (VB) to the conduction band (CB), thereby generating electron-hole pairs. This photoexcitation governs the spectral response range and energy conversion efficiency. Common photocatalysts like TiO2 and ZnS primarily absorb ultraviolet light, though visible light absorption is highly desirable. Enhancing light harvesting efficiency is crucial for improving quantum yield and catalytic performance in applications such as pollutant mineralization, water splitting, and CO2 reduction. Consequently, optimizing light absorption characteristics—particularly broadening the response range and enhancing visible light utilization—represents a core research objective. Strategies include material design, structural modulation, and surface engineering [185].
ii) Charge separation and migration: The photogenerated electron-hole pairs must rapidly separate to prevent recombination within the catalyst bulk or on its surface. This separation can be facilitated by internal electric fields, grain boundary effects, or surface modifications. Efficient separation and subsequent migration of carriers to the catalyst surface are pivotal determinants of photocatalytic activity. Yet the significant recombination losses occur during transit or upon surface arrival, dissipating energy as heat or light. Minimizing recombination is therefore essential for enhancing overall efficiency [186].
iii) Surface redox reactions: Effectively separated charge carriers participate in redox reactions at the photocatalyst surface. Photoexcited electrons typically reduce adsorbed oxidants (e.g., O2, H2O), while holes oxidize adsorbed reductants (e.g., organic pollutants, H2O). The specific reactions depend on the donor-acceptor properties of the adsorbed species. Long-lived carriers exhibit greater potential to drive targeted redox pathways, enabling pollutant degradation or solar fuel synthesis [187].
Nonetheless, the practical deployment of photocatalytic materials remains encumbered by significant limitations: i) Narrow spectral response. Many catalysts (e.g., TiO2) are primarily UV-active, limiting solar energy utilization. ii) Rapid charge recombination. High recombination rates lead to low quantum efficiencies. iii) Limited active sites. Agglomeration of nanoparticles reduces specific surface area and accessible reaction sites, hindering scalability [188].
The synergistic optimization of these is critical for driving thermodynamically unfavorable reactions using light energy. Key strategies include selecting appropriate photocatalysts, optimizing surface properties, and enhancing charge separation efficiency to improve reaction rates and selectivity.
Hollow structures offer a promising solution by leveraging unique geometric designs. Their multi-shell or cavity configurations enhance light harvesting through multiple internal reflections, extending the photon path length and improving capture efficiency [49]. This concept pioneered by Li, Lu et al. in 2007 using hierarchical sphere-in-sphere TiO2, demonstrated enhanced UV photon utilization and significantly improved phenol degradation [189]. Furthermore, the high specific surface area of hollow structures provides abundant active sites, while thin shell layers shorten carrier migration distances, suppressing recombination. For instance, Fe3O4@TiO2 core-shell hollow structures exhibit superior RhB degradation compared to P25 TiO2 and enable facile magnetic separation [190]. Hollow structure design combined with non-metallic element doping is an effective strategy for tailoring the electronic structure and bandgap of photocatalysts, significantly boosting efficiency [191].
Graphitic carbon nitride (g-C3N4), a metal-free semiconductor, has attracted considerable attention due to its low cost, earth abundance, suitable bandgap, and excellent chemical stability [192]. Numerous non-metal doped g-C3N4 catalysts and heterostructures now surpass pristine g-C3N4 in performance [191].
Liu et al. reported the fabrication of a highly efficient three-dimensional hollow porous carbon nitride (CPCN) catalyst via synergistic morphological engineering and in situ carbon doping (Figures 12a-c). The resultant CPCN material exhibited a significantly enhanced diclofenac degradation rate of 20.3×10⁻³·min⁻¹ under visible light irradiation (Figure 12d) and superior hydrogen evolution performance at a rate of 16.69 mmol·g-1·h-1 (Figure 12e). Structural characterization combined with density functional theory (DFT) simulations revealed that the hierarchical 3D hollow porous architecture imparts CPCN with a large specific surface area and abundant exposed active sites, concurrently enhancing substrate adsorption kinetics and structural integrity. Furthermore, in situ carbon doping modulated the optical absorption properties of CPCN, thereby promoting efficient charge carrier separation and migration. These synergistic structural and compositional modifications collectively contribute to the exceptional photocatalytic performance of the CPCN catalyst [193].
Similarly, Zheng et al. achieved precise optimization of graphitic carbon nitride (g-C3N4) structure and properties through controlled precursor composition and synthesis methodology. As illustrated in Figure 12f, samples were prepared via distinct routes: (U) urea thermal polymerization, yielding a porous structure from gaseous decomposition products; (M) direct thermal polymerization of melamine, resulting in a dense layered structure with minimal porosity; (MC) thermal decomposition of a melamine-cyanuric acid supramolecular complex, where cyanuric acid templating generated an open porous framework with a specific surface area (52.2 m2·g-1) and pore volume (0.37 cm3·g-1) increased 8.0-fold and 6.6-fold, respectively, relative to M; (MCB0.07) carbon-doped MC via barbituric acid incorporation into the supramolecular framework via hydrogen bonding, followed by N-site carbon doping during thermal polymerization, further increasing specific surface area (78.8 m2·g-1), pore volume (0.46 cm3·g-1), and the C/N mass ratio (0.61 vs. 0.60 for MC), confirming successful doping. These structural variations directly governed photocatalytic activity (Figure 12g): M exhibited the lowest degradation rates due to limited active site accessibility. The porous structure of MC enhanced pollutant adsorption and mass transfer, substantially increasing reaction kinetics relative to M. MCB0.07 demonstrated synergistic optimization, combining the porous structure with carbon doping to enhance charge separation efficiency (evidenced by lower photoluminescence intensity versus MC), yielding degradation rate constants for atrazine and sulfamethoxazole of 0.59 and 0.61 m2·(mol photons)-1, respectively—nearly double those of MC (0.30 m2·(mol photons)-1)—and phenol degradation activity comparable to U (0.37 vs. 0.32 m2·(mol photons)-1). This study demonstrates that carbon doping enhances the photocatalytic oxidation capacity of g-C3N4 by modulating the band structure (e.g., inducing a more negative conduction band potential favorable for ·O2- generation) and increasing surface defects, providing robust experimental support for non-metallic doping strategies in environmental remediation [194].
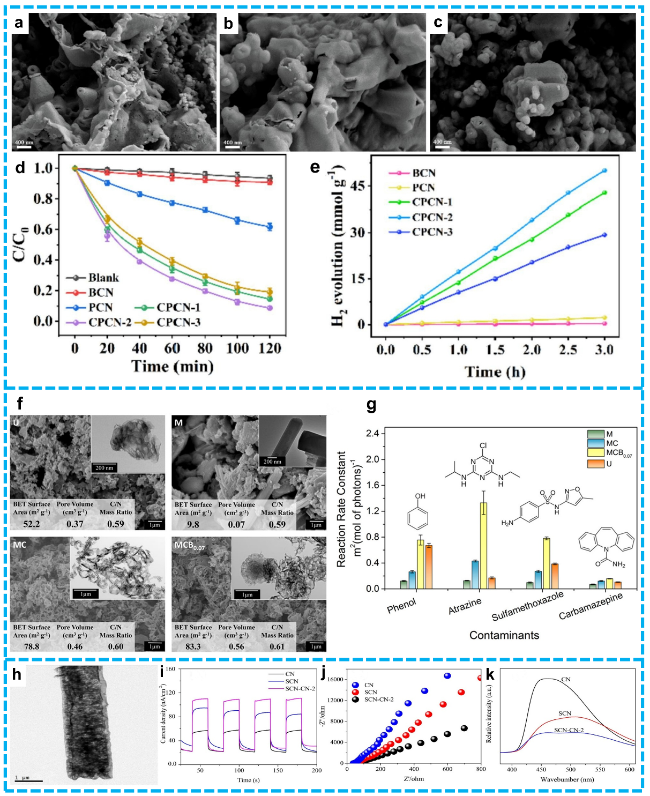
Figure 12 SEM images of a) CPCN-1, b) CPCN-2, c) CPCN-3; d) Photocatalytic degradation of DCF by the as-prepared samples; e) H2 generation of the BCN, PCN and CPCN catalysts [193]. Copyright 2022, Elsevier. f) SEM and TEM (insets) images of g-C3N4 samples U, M, MC, and MCB0.07; g) Photocatalytic degradation rate constants of U, M, MC, and MCB0.07 [194]. Copyright 2016, American Chemical Society. h) TEM images of SCN-CN-2, The photocurrent (i), EIS (j), and PL k) of as-prepared samples [195]. Copyright 2021, Elsevier. |
Furthermore, Liang et al. engineered a highly active hollow tubular g-C3N4 isostructural heterojunction (SCN-CN, Figure 12h) to augment visible-light harvesting and regulate directional charge transfer. Ultraviolet-visible diffuse reflectance spectroscopy (UV-Vis DRS), XPS band structure analysis, and DFT calculations collectively demonstrate that sulfur doping enhances visible-light absorption relative to pristine g-C3N4 (CN) and modifies the band structure, promoting photoexcited electron migration from CN to SCN and hole transfer from SCN to CN under visible light. Concurrently, the tubular architecture facilitates longitudinal electron transport along the tube axis, suppressing carrier recombination. Consequently, the SCN-CN-2 heterojunction achieved optimal charge separation efficiency, evidenced by the strongest photocurrent response (Figure 12i), smallest electrochemical impedance arc (Figure 12j), and lowest photoluminescence intensity (Figure 12k). The integrated experimental and theoretical approach systematically elucidated the optical characteristics, electronic structure, and charge transfer dynamics of SCN-CN. Rigorous evaluation under simulated visible light irradiation confirmed the enhanced photocatalytic degradation efficiency of SCN-CN towards model pollutants tetracycline hydrochloride (TCH) and rhodamine B (RHB) [195].
4. In Situ Testing Techniques Combined with First Principles Calculation in Hollow-structured Materials
Following the detailed elaboration on the various synthesis methods and application scenarios of hollow-structured materials in the preceding sections, it is equally critical to investigate the underlying mechanisms during their application. A profound understanding of these mechanisms enables the further rational functionalization and modification of the materials, enhancing their suitability for specific application requirements.
The exploration of these mechanisms necessitates the indispensable application of diverse characterization techniques. With the continuous development of material modification methods and the increasing complexity of chemical reaction systems, the demands placed on characterization techniques have become more stringent. Beyond ex situ characterization techniques such as X-ray diffraction (XRD), scanning electron microscopy (SEM), transmission electron microscopy (TEM), X-ray photoelectron spectroscopy (XPS), electrochemical impedance spectroscopy (EIS), photoluminescence (PL) spectrum, time-resolved photoluminescence (TRPL), ultraviolet-visible (UV-vis) spectrum, incident photon-to-current conversion efficiency (IPCE), DMPO spin-trapping electron paramagnetic resonance (EPR), surface photovoltage (SPV), and in situ diffuse reflectance infrared Fourier transform spectroscopy (DRIFTS), which characterize and determine the intrinsic state of materials. Various quasi in situ and in situ characterization techniques are becoming increasingly pivotal for exploring reaction mechanisms under real-time operating conditions. The following sections will partially detail the principles of corresponding in situ techniques combined with first principles calculation for mechanistic analysis, specifically addressing the application scenarios and reaction systems of hollow-structured materials discussed previously [196-200].
4.1 In Situ Irradiation X-ray Photoelectron Spectroscopy (ISI-XPS) Facilitates Exploration of Intrinsic Mechanisms
Scientific community has increasingly acknowledged the critical importance of elucidating the pathways of photogenerated electrons at material interfaces during photocatalytic processes. A fundamental understanding of these charge carrier dynamics is indispensable for developing mechanistic insights into photocatalytic phenomena and establishing rational design principles for advanced photocatalyst architectures [201]. XPS is a surface-sensitive analytical method conventionally employed to probe element-specific chemical environments, inherently captures electronic structure modifications, and initially focused primarily on determining the directionality of electron flow across interfaces. In this context, in-situ irradiated X-ray photoelectron spectroscopy (ISI-XPS) has emerged as a particularly promising technique for the direct detection of photogenerated electron transfer dynamics [202,203]. As comprehension of the technique matured, researchers recognized its utility for emerging research exploring parameters such as excitation wavelength, binding energy shifts, and quantitative electron transfer volumes suggests ISI-XPS holds significant potential for deeper exploration within the photocatalysis domain. To date, ISI-XPS has been successfully applied to characterize diverse systems, including hollow structured heterostructure catalysts. The fundamental insights derived from such studies are paramount for driving continuous innovation and accelerating the development of next-generation catalytic materials.
4.1.1 The ISI-XPS Instrument Fundamental Principles
During spectral acquisition, the sample surface is irradiated with photons of precisely defined energy. The core-level binding energy (Ebe) of the emitted photoelectrons is derived directly from their measured kinetic energy (Eke) using Einstein's photoelectric equation: Ebe=hv-Eke, where hv is the energy of the incident monochromatic X-ray photon [204,205]. A fraction of the photoelectrons generated near the sample surface are emitted into the vacuum. These electrons traverse the electron optics and are subsequently focused through the entrance slit of the spectrometer analyzer. The spectrometer is designed to measure the electron current (proportional to the number of electrons per unit time) as a function of kinetic energy. The resulting plot of electron intensity versus binding energy constitutes the XPS spectrum. X-ray irradiation is confined with the maximum information depth typically limited to approximately 10 nm. The most intense peak within an element's spectrum is designated as its characteristic peak, thereby providing definitive elemental identification.
The ISI-XPS analysis is performed utilizing a standard XPS instrument equipped with an integrated illumination accessory, as depicted in Figure 13a-c. The initial measurement is conducted under dark conditions to establish the baseline binding energy (BE). Subsequently, the excitation wavelength is then selected to correspond with the characteristic absorption wavelength of the sample material, enabling the commencement of in-situ testing. Irradiation of a semiconductor photocatalyst with photons possessing energy equal to or exceeding its bandgap induces electronic excitation. This process generates photogenerated charge carriers (electrons and holes), promoting electrons from the valence band to the conduction band and creating reactive species, leading to localized alterations in electron density (Figure 13d-f) [206].
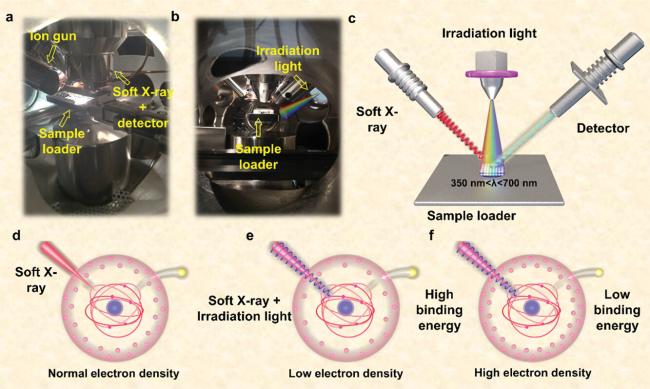
Figure 13 a) Front windows photographs of ISI-XPS device; b) Side windows photographs of ISI-XPS device; c) Schematic illustration of ISI-XPS device; d-f) Effect of electron density on binding energy [207]. Copyright 2022, John Wiley and Sons. |
The shielding effect theory provides the framework for interpreting BE shifts. An increase in electron density within the outer atomic layers attenuates the effective nuclear charge experienced by core-level electrons. This reduced electrostatic attraction consequently enhances the kinetic energy of the emitted photoelectrons. According to the Einstein's photoelectric equation (Ebe= hv -Eke), under constant excitation energy (hv), an increase in kinetic energy necessitates a concomitant decrease in binding energy. Conversely, a reduction in kinetic energy corresponds to an increase in binding energy. Consequently, variations in electron density manifest directly as shifts in core-level binding energies. Electron depletion (reduced electron density) results in a positive BE shift (increase), typically observed for the primary catalyst element. Conversely, electron accumulation (increased electron density) yields a negative BE shift (decrease). Analysis of these BE shifts` thus allows for the determination of the directionality of electron flow between the constituent materials under simulated illumination conditions.
4.1.2 The Application of ISI-XPS in Hollow-structured Materials
The use of multi-level structures can also serve to maximize the inhibition of photo-generated charge recombination and maximize the utilization of electrons.
Zhang et al. constructed a multi-level separation yolk-shell hollow structure (Figure 14a-b), SiO2/Ni2P/rGO/Cd0.5Zn0.5S [208], for photo generated electrons, which maximized the inhibition of photo generated electron recombination. The photocatalytic performance test showed that the activity of this multi-level separation structure is about 14 times higher than that of pristine Cd0.5Zn0.5S (Figure 14c-d). The stability test in Figure h also indicated that this structure can exist stably in catalytic reactions, and the hollow structure would not collapse with the progress of the reaction. The results of ISI-XPS testing indicated that the photo generated electrons generated by Cd0.5Zn0.5S flow towards Ni2P through rGO (Figure 14e-g), achieving the separation of photo generated charge carriers. The energy level structure verifies the migration direction of electrons (Figure 14i), and Figure 14j shows the mechanism by which this multi-level structure enhances catalytic activity.
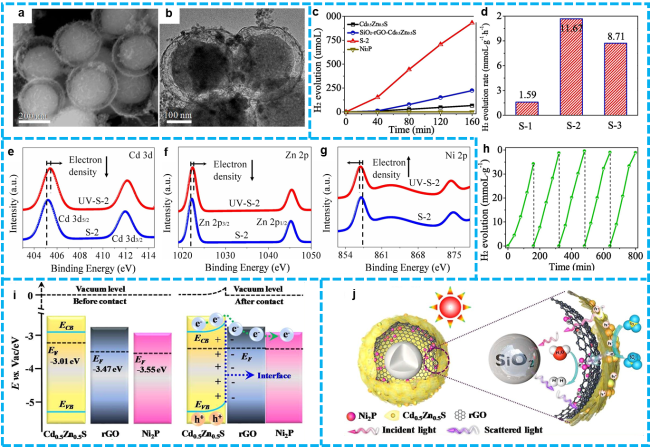
Figure 14 a) The SEM and b) TEM images of as-prepared yolk-shell structural SiO2/Ni2P/rGO/Cd0.5Zn0.5S sample; c) The time dependent H2 evolution over different samples; d) the H2 production rate of different ration composites; h) recycling test over the S-2 composite under visible light irradiation, e-g) High-resolution XPS spectra of the S-2 composite in the dark and under LED irradiation (λ=365 nm): Cd 3d, Zn 2p and Ni 2p; i) Band structure diagram of the Cd0.5Zn0.5S, rGO and Ni2P; j) Photocatalytic mechanism of H2 generation in the yolk-shell structural SiO2/Ni2P/rGO/Cd0.5Zn0.5S nanoreactor [208]. Copyright 2021, Elsevier. |
Li et al. established a g-C3N4/SnO2 as a model heterostructure photocatalyst to investigate the relationship between binding energy and incident wavelength [209]. The morphology characterization represented g-C3N4 was coated at the surface of SnO2 nanoparticles (Figure 15a, e). After verifying the synthesis of photocatalyst, the ISI-XPS equipped with a continuous tunable wavelength light source was carried out. Figure 15b-d showed the results of Sn 3d in SnO2, composite photocatalyst and calibrated results of composite photocatalyst, respectively. It could be seen that the change in binding energy increased as the wavelength got shorter. In this situation, a Boltzmann function was proposed to describe the relationship between binding energy changes and irradiated wavelength (Figure 15g). Besides, in Figure 15f, an asymptotic function model was also offered to describe the relationship between binding energy and element valence states, achieving preliminary research on electron quantification. This study is the inaugural investigation into the alterations in binding energy as a function of light sources with disparate wavelengths. It has uncovered the intrinsic correlation between binding energy, valence state, and wavelength.
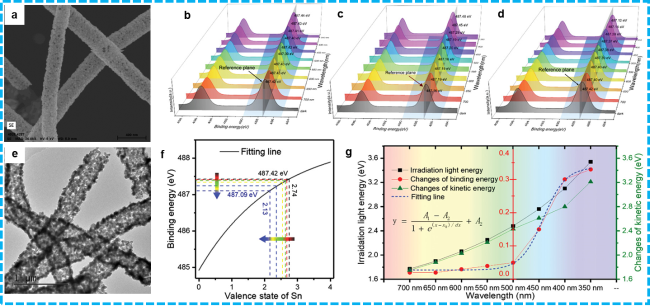
Figure 15 a) The SEM image of g-C3N4/SnO2; e) HRTEM of g-C3N4/SnO2; b) ISI-XPS result of g-C3N4/SnO2 before charge compensation; c) ISI-XPS result of SnO2; d) ISI-XPS result of g-C3N4/SnO2 after charge compensation; f) The fitting curve of the relation between binding energy and valence state of Sn element in g-C3N4/SnO2; g) Relationship of irradiation light energy, changes of binding energy, and kinetic energy of Sn 3d5/2 in g-C3N4/SnO2. [209]. Copyright 2023, Elsevier. |
4.2 In Situ Surface Attenuated Total Reflection Fourier Transform Infrared Spectroscopy (ATR-FTIR) Combining with First Principles Calculation Facilitates Exploration of Intrinsic Mechanisms.
Researchers have elucidated diverse perspectives on electrocatalytic mechanisms from both thermodynamic and kinetic viewpoints, employing a variety of advanced techniques. In situ spectroscopy further serves as a critical experimental approach, enabling real-time monitoring of dynamic evolution in catalyst surface structures and intermediate species during electrocatalytic processes. This capability makes it an indispensable tool for unraveling the fundamental reaction mechanisms in electrocatalysis. First-principles calculations, particularly those based on density functional theory (DFT) [1,210,211], have become an indispensable and powerful tool in modern materials science and catalysis research. Rooted in the fundamental principles of quantum mechanics, this approach relies on no empirical parameters and predicts various material properties solely based on atomic species and spatial arrangements. It allows researchers to probe the intrinsic characteristics of materials and chemical reaction processes at the atomic and electronic levels, thereby enabling the rational design of material functions and offering profound insights into catalytic mechanisms.
4.2.1 ATR-FTIR Fundamental Principles
ATR-FTIR is a highly sensitive detection technique developed based on the surface enhanced infrared absorption (SEIRA) effect. The SEIRA effect refers to the phenomenon in which metal island films significantly enhance the infrared absorption intensity of surface-adsorbed molecules [212]. It was first observed by Hartstein et al. during their study of the adsorption behavior of p-nitrobenzoic acid molecules on Au and Ag island films [213]. The electromagnetic field mechanism postulates that when incident infrared light irradiates a rough metal surface, the free electrons on the metal surface oscillate under the influence of the optical electric field, giving rise to localized surface plasmon resonance (LSPR). This results in a significant enhancement of the local electromagnetic field intensity at the metal surface. The localized electromagnetic field is polarized perpendicularly to the metal surface and its strength decays exponentially with increasing distance from the surface. As a consequence, the effective enhancement distance of the SEIRS effect is limited to within 10 nm. This characteristic precisely enables SEIRAS to minimize interference from the bulk solution. This surface selection rule allows SEIRAS to elucidate the orientation of molecules adsorbed on the surface [214,215]. The core of the chemical enhancement mechanism lies in the interaction between adsorbed molecules and atoms on the metal surface. Resonance occurs when the energy of the incident light matches the energy difference required for this charge transfer process. This leads to an increase in the vibrational dipole moment of the adsorbed molecules, thereby enhancing the infrared absorption signal [216].
SEIRAS has attracted significant attention owing to its unique technical advantages, including high sensitivity, the ability to determine molecular orientation, minimal interference from electrolyte solutions, and the compatibility of metallic thin films as working electrodes in electrochemical systems. These attributes have established SEIRAS as a powerful tool for investigating electrochemical interfaces, and it is now widely applied in studies of electrocatalysis, electrode reaction mechanisms, and surface adsorption processes.
To leverage the SEIRA effect in practical research, various operational modes of SEIRAS have been developed, including transmission mode [217], external reflection mode [218], and attenuated total reflection (ATR) mode [219]. The attenuated total reflection (ATR) mode employs a high-refractive-index crystal (e.g., ZnSe, Si, or Ge) as an internal reflection element. When infrared light is directed onto the crystal surface at an angle greater than the critical angle, total internal reflection occurs. During this process, an evanescent wave penetrates into the sample and interacts with molecules adsorbed on the nanostructured metal surface, thereby enhancing the infrared absorption signal, as depicted in Figure 16 [220].
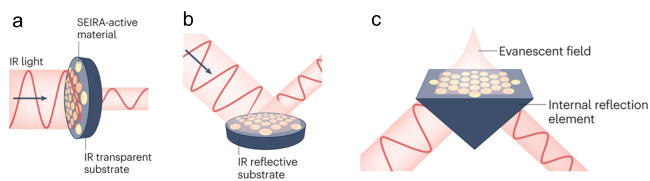
Figure 16 Schematic illustration of the three primary SEIRAS techniques: a) transmission mode, b) external reflection mode, and c) attenuated total reflection (ATR) mode [221]. |
Compared to transmission and external reflection SEIRAS techniques, ATR offers effective suppression of solvent interference, lower background absorption, reduced detection limits, higher signal-to-noise ratio, and superior sensitivity. Owing to these advantages, ATR-FTIR has been widely adopted in studies of electrochemical systems [212]. A schematic diagram of the in situ ATR-FTIR experimental setup is shown in Figure 17.
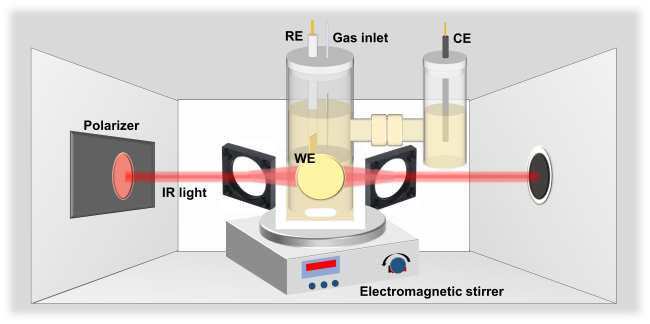
Figure 17 Schematic diagram of an in situ electrochemical ATR-FTIR setup equipped with stirring capability [222]. |
4.2.2 The Application of SEIRAS Combining with First Principles Calculation for Elucidation of Catalytic Mechanisms
Conventional electrochemical techniques, such as Tafel slope analysis, exhibit limitations in distinguishing subtle differences in microscopic pathways during catalytic processes. In contrast, SEIRAS capitalizes on the localized surface plasmon resonance (LSPR) effect of metallic thin films to significantly enhance the infrared signals of adsorbed species, thereby facilitating the detection of intermediates even at low surface coverages [223]. Furthermore, SEIRAS can be coupled with an electrochemical workstation to monitor in real time the vibrational characteristics of intermediates adsorbed on the electrode surface (e.g., *H, *OH), providing critical insights into the reaction mechanism [224].
Structural engineering has been demonstrated as an effective strategy to enhance the performance of catalysts [225,226]. Wang et al. [227] developed a facile galvanic replacement strategy to synthesize octahedral PdRuCu nanocages (NCs) (Figure 18a) using Cu2O octahedra as templates, offering dual advantages: (1) significantly improved atom utilization efficiency, thereby reducing overall catalyst costs [228]; and (2) simultaneous accessibility of both external surfaces and internal cavities to reactant molecules, which not only maximizes the electrochemically active surface area but also promotes mass transport, ultimately accelerating kinetics [229]. In situ FTIR reveals that the introduction of Ru favors OH adsorption, thereby promoting CO oxidation in Figure 18b-c. This work presents a simple yet effective strategy for designing high-performance catalysts with superior efficiency and low production costs, offering significant potential for practical applications. Density functional theory (DFT) calculations indicate that the co-adsorption of CO and OH species on PdRuCu NCs enables electron interaction between OH and CO species in Figure 18d-h, facilitating the formation of CO2 through synergistic effect. Figure 18e presents the free energy landscape (ΔG) for the Langmuir-Hinshelwood type CO oxidation mechanism on both catalytic surfaces. Thermodynamic analysis reveals spontaneous chemisorption of reactants, with CO exhibiting stronger binding affinity on Pd3Cu4 (ΔG = −1.2 eV) compared to Pd3RuCu4, while OH species show preferential stabilization on the Ru-modified surface (ΔG = −0.8 eV). This reduced kinetic bottleneck correlates with the experimentally observed enhancement in FAOR activity, where the Ru-alloyed Pd catalyst achieves a high current efficiency at 0.3 V vs RHE. The attenuated CO binding strength (−0.8 eV vs −1.2 eV) coupled with optimized OH activation energetics creates a synergistic effect that simultaneously mitigates CO poisoning while accelerating the CO2 desorption kinetics.
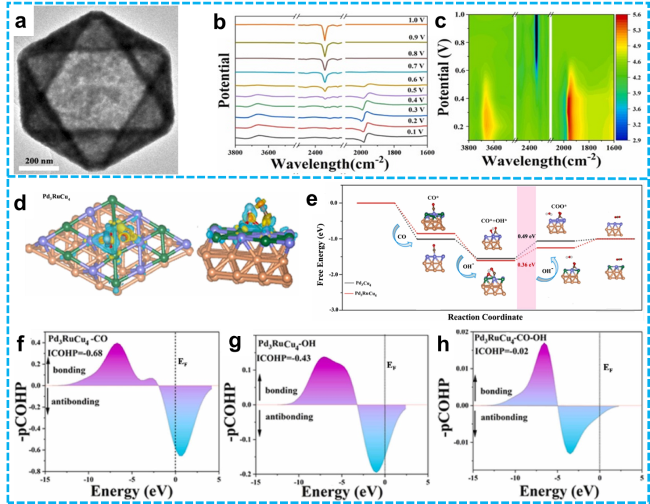
Figure 18 a) TEM images of Pd3RuCu4 NCs; In situ FTIR spectral analysis of adsorbed species on Pd3RuCu4 NCs: b) FTIR spectra and c) contour maps of OH, CO, and CO2 adsorption; d) Local charge density difference of CO co-adsorbed with OH; e) Energy profile comparison for CO oxidation to CO2; f) Crystal orbital Hamilton population (pCOHP) analysis: g) CO adsorption, h) OH adsorption. [227]. Copyright 2025, Elsevier. |
Zhang et al. [230] strategically engineered atomically dispersed cobalt-copper diatomic pairs anchored on CeO2 hollow nanostructures (Figure 19a) to systematically investigate the interplay among coordination architecture, metal-support interactions, and their collective influence on OER/ORR. The influence of the mechanism pathway on the adsorption of reaction intermediates is measured by in situ Fourier transform infrared (FTIR) spectroscopy. The in situ FT-IR spectra of CoCu@CeO2 for OER (in 1.0 m KOH) and ORR (in O2-saturated 0.1 m KOH solution) are shown in Figure 19b-c. During OER, an infrared absorbed peak of *OOH (at ≈1230 cm−1) appeared under anodic potentials and gradually enhanced when the voltage applied changed from 1.2 to 1.8 V. The increase of *OOH intermediates corroborated the traditional four-step adsorbate evolution mechanism reaction pathway of the CoCu@CeO2 catalyst. In addition, under ORR operating conditions, there are four absorption peaks. As the applied voltage decreases, the intensity of the peak at 1180 cm−1 increases gradually, suggesting that the coupling of *OOH species is a dynamic process. The absence of peroxo-like oxygen (*O─O*) at ≈1090 cm−1 confirms that CoCu@CeO2 catalysts follow the 4e− associative ORR pathway. This work proposes a novel mechanism for engineering dual-atom architectures through long-range electronic interactions, providing valuable insights into the advancement of advanced electrocatalysts for sustainable energy conversion systems. In Figure 18d-g, systematic DFT simulations further demonstrated that the LRS coupling between bimetallic centers induces significant electronic structure modifications, including optimized d-bandcenter positions and reduced energy barriers compared to single-atom counterparts. The synergistic interplay between geometrically optimized active sites and enhanced metal-support charge transfer simultaneously facilitates oxygen intermediate adsorption/desorption kinetics. This atomic-level engineering of heteronuclear diatomic systems not only offers deep insights into long-range electronic correlations in oxide-supported catalysts but also establishes a novel framework for atomic-level catalyst design in advanced energy conversion technologies [231,232].
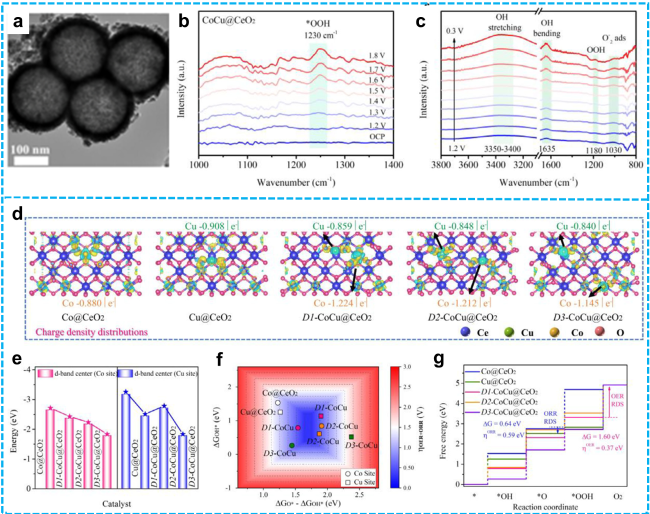
Figure 19 a) TEM images of CoCu@CeO2; In situ FT-IR spectra of CoCu@CeO2 for b) OER and c) ORR; Theoretical calculation: d) Charge density distributions and Bader charge at the Co and Cu sites; e) the d-band center at the Co and Cu sites for Co@CeO2, Cu@CeO2, D1-CoCu@CeO2, D2-CoCu@CeO2, and D3-CoCu@CeO2; f) Calculated total theoretical overpotential (𝜂total) volcano plot with ΔGO*−ΔGOH* and ΔGOH* as descriptors; g) Theoretical overpotential of the catalyst for OER (at Co site) and ORR (at Cu site) for Co@CeO2, Cu@CeO2, D1-CoCu@CeO2, D2-CoCu@CeO2, and D3-CoCu@CeO2 [230]. Copyright 2025, John Wiley and Sons. |
Furthermore, Zhang et al. [233] designed hybrid Co2.5Ru0.5Ox hollow nanotubes (Figure 20a) with abundant Co3O4-x-RuO2-x interfaces by a self-assembled electrospinning method, the in situ Fourier transform infrared spectroscopy revealed that the unique hollow nanotube structure allows OH- reactants to be readily adsorbed on both exterior and inner nanotube surfaces, providing a driving force for activating interfacial lattice oxygen participation mechanism (LOM). Figure 20b-c displayed the operando FTIR spectra of hybrid Co2.5Ru0.5Ox and single-phase Co3O4 under different OER potentials. It is noteworthy that the OH- absorption band of hybrid Co2.5Ru0.5Ox was the maximum and became larger with increasing voltages, providing strong evidence for its excellent OH- adsorption capability. In conclusion, the unique porous hollow nanotube structure endowed the hybrid Co2.5Ru0.5Ox with an excellent OH- adsorption capability to accelerate the OER, which could serve as a beneficial driving force to activate the underlying interfacial LOM. Combined LOM mechanism experiments and density functional theory (DFT) calculations demonstrated the exceptional interfacial LOM processes on the self-optimized Co-O-Ru motifs through an interfacial oxygen-vacancy pathway (Figure 20d-h).
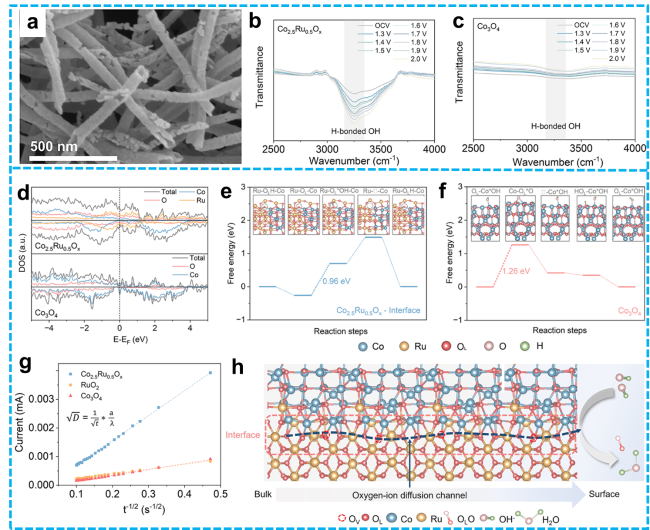
Figure 20 a) SEM image of hollow-nanotube hybrid Co2.5Ru0.5Ox composites; b-c) In situ FTIR spectra of hollow-nanotube hybrid composites; d) DOS diagrams of hybrid Co2.5Ru0.5Ox and Co3O4; Free energy diagram of the LOM pathway for e) hybrid Co2.5Ru0.5Ox with Co-O-Ru interfaces and f) Co3O4; g) Chronoamperometry test of synthesized samples to calculate oxygen ion diffusion coefficients; h) Mechanistic diagram of lattice oxygen-ion diffusion at the Co3O4-x-RuO2-x interface [233]. Copyright 2025, ACS Publications. |
SEIRAS offers substantial experimental support for the investigation of electrocatalytic reaction mechanisms by virtue of its exceptional sensitivity and in situ characterization capability. This technique has proven particularly valuable in elucidating the behavior of adsorbed intermediate species. Evidence derived from SEIRAS-based studies has not only enhanced the fundamental comprehension of reaction pathways but has also provided a critical theoretical foundation for the rational design and development of novel, high-efficiency electrocatalysts, thereby accelerating progress within the field of electrocatalysis. High-throughput calculations can enhance the understanding of physical mechanisms by providing atomistic-level dynamic visualizations and quantitative energy descriptions. For surface catalytic reactions, such computations enable the simulation of different adsorption sites, elucidate reaction pathways and mechanisms, and evaluate catalyst performance descriptors. However, their accuracy is influenced by the choice of exchange-correlation functionals (e.g., the bandgap problem), the limited size of simulated systems (typically up to several hundred atoms), and short timescales (picoseconds to nanoseconds). Thus, they cannot fully replace experimental validation.
5. Summary and Outlook
Hollow nanostructures, distinguished by their intrinsic geometric advantages—including high specific surface area, tunable cavities, and reduced mass transfer lengths—alongside functional modularity, have emerged as transformative materials for energy storage and conversion [8,210,211,234 -240]. This review systematically examines their design principles, synthetic methodologies, and application advancements in lithium-ion batteries, supercapacitors, lithium-sulfur batteries, and photo/electrocatalysis. Synergistic innovations in structural engineering and compositional design have effectively mitigated key challenges such as electrode volume expansion, polysulfide shuttling, and charge carrier recombination. Furthermore, hierarchical porosity, multi-shell configurations, and optimized heterointerfaces have significantly enhanced energy density and cycling stability. Nevertheless, critical challenges remain, including controllable synthesis, elucidation of structure-property relationships, and scalable implementation. Future research should prioritize:
i) Green, precise, and scalable synthesis: Develop green and low-cost templates (e.g., biomass-derived templates) or more intelligent template-free strategies. Explore novel synthetic techniques such as continuous-flow synthesis, microwave-assisted synthesis, and plasma-enhanced synthesis to achieve efficient, controllable, and scalable preparation. Integrate machine learning and artificial intelligence to optimize synthesis parameters through big data analysis, predict structure-property relationships, accelerate the discovery of new materials, and design synthesis pathways, thereby reducing trial-and-error costs [241-243].

Figure 21 Outlook for future research on hollow structures. |
ii) Structural optimization and functional innovation: Advance from simple “hollow” structures to intelligent and multifunctional architectures. For instance, design intelligent hollow structures with tunable shell permeability, self-healing capabilities, or responsiveness to external stimuli (light, heat, pH) [244]. Further refine the precise control of hierarchical porosity, gradient compositions, and heterogeneous interfaces to achieve synergistic effects among functional components.
iii) Deepening mechanistic understanding: Vigorously develop and utilize in situ/operando characterization techniques (e.g., in situ TEM, XRD, FTIR, SEM) to observe the real-time evolution of structure, composition, and valence state of materials under working conditions, directly revealing failure mechanisms [245,246]. Combine theoretical methods such as first-principles calculations (DFT) and molecular dynamics (MD) simulations to gain atomic- and electronic-level insights into mass/charge transfer processes and catalytic reaction mechanisms within hollow structures, providing theoretical guidance for precise design.
iv) Device integration for practical applications: Investigate methods to improve the tap density and electrode processing performance of hollow-structured materials, and explore the fabrication of self-supported electrodes that eliminate the need for inert binders. Enhance performance evaluation of hollow materials in full-cell/full-device configurations—rather than merely half-cell tests—focusing on overall energy density, cycle life, and safety under practical electrode coupling conditions [247-255].
Hollow-structured materials have emerged as a highly dynamic research direction in the field of energy. Future breakthroughs will hinge on close collaboration among chemistry, materials science, engineering, and theoretical computations to collectively address a series of scientific and technological challenges—from fundamental synthesis to practical applications—ultimately unlocking the socio-economic value of these high-performance materials.
CRediT author statement
Yiran Sun: Writing-original draft, Validation, Methodology, Investigation, Formal analysis, Data curation, Conceptualization.
Changqu Liu: Investigation, Formal analysis.
Shuqi Ji: Methodology, Investigation.
Jinbo Ni: Software, Data curation.
Xiangning Wu: Visualization.
Sembukuttiarachilage Ravi Pradip Silva: Validation, Resources.
Meng Cai: Supervision, Conceptualization.
Guosheng Shao: Supervision, Resources, Funding acquisition.
Peng Zhang: Supervision, Methodology, Funding acquisition, Conceptualization.
Acknowledgments
The work was supported by the National Natural Science Foundation of China (No. 52472110,U2004172, 51972287), the Central Plains Science and Technology Innovation Leading Talents (254200510052), the National Natural Science Foundation of Henan Province (No. 242300421008), and the Program for Science& Technology Innovation Talents in Universities of Henan Province (23HASTIT001).
Declaration of conflict of interest
The authors declare that they have no known competing financial interests or personal relationships that could have appeared to influence the work reported in this article. Peng Zhang is an Editorial Board Member of this journal and he was not involved in the editorial review or the decision to publish this article.