


1 Introduction
The rapid progression of science and technology has markedly escalated the consumption of fossil fuels, precipitating profound environmental degradation and exacerbating energy scarcity [1-5]. In response to these critical challenges, the scientific community has increasingly directed its efforts toward exploring renewable energy alternatives, including biomass, solar, nuclear, ocean, and wind energy. Among these, solar energy emerges as an exceptionally promising option, distinguished by its renewable, clean, and inexhaustible characteristics. Advances in solar energy technologies not only diminish reliance on fossil fuels but also play a pivotal role in reducing greenhouse gas emissions and mitigating the impacts of global warming [6-10]. Notably, semiconductor-based photocatalytic technologies have gained prominence as an efficient approach to harnessing solar energy, providing carbon-neutral and sustainable substitutes for conventional fossil fuel utilization.
Since the seminal work of Fujishima and Honda in 1972 on TiO2-based photocatalytic water splitting, a substantial body of research has been devoted to the discovery and development of novel semiconductor photocatalysts. To date, more than 2, 000 semiconductor materials have been identified, predominantly encompassing transition-metal-based oxides, sulfides, and nitrides [11-13]. Despite these advancements, the practical efficiency of these materials remains constrained by their suboptimal spectral alignment with solar radiation, which hinders the effective generation of electron-hole pairs essential for photocatalytic processes [14-17].
The breakthrough introduction of carbon nitride as a photocatalyst in 2009 represented a pivotal turning point, shifting research focus toward non-metallic semiconductors [18]. Within this emerging field, phosphorus has garnered significant interest due to its distinctive physicochemical properties and the versatility of its allotropes [19-21]. Among these, black phosphorus (BP) has exhibited substantial promise in photocatalysis, owing to its layered architecture and adjustable bandgap. More recently, red phosphorus (RP) has surfaced as a compelling alternative, distinguished by its abundance, low toxicity, cost-effectiveness, and enhanced chemical stability [22-25].
RP manifests in multiple isomeric forms, including amorphous (ARP), hexagonal (h-RP), metastable (m-RP), triskelion fiber, and monoclinic Hittorf’s phosphorus (m-HRP), each characterized by unique structural attributes and functional capabilities [26-29]. Significantly, RP exhibits a bandgap spanning 1.5 to 2.2 eV, enabling efficient absorption of visible light-the predominant constituent of the solar spectrum [30-36]. This attribute is instrumental in bolstering the efficacy of solar-driven photocatalysis. Additionally, RP’s environmentally benign profile and advantageous electronic properties position it as a highly attractive alternative to traditional metal-based photocatalysts [37-40].
Notwithstanding its inherent advantages, the practical deployment of RP in photocatalysis is impeded by several challenges. Its intrinsically low specific surface area and poor dispersibility in bulk form substantially curtail photocatalytic efficiency [41-42]. Moreover, the rapid recombination of photogenerated electron-hole pairs further compromises its performance. To surmount these constraints, recent investigations have pursued a range of strategies, including nanostructuring, heterojunction engineering, and surface modification, aimed at amplifying the photocatalytic activity of RP. These developments offer considerable promise for realizing the full potential of RP in sustainable energy applications [43-47].
This review consolidates recent progress in the development of RP-based photocatalysts, emphasizing diverse synthesis methodologies, structural enhancements, and strategies designed to elevate photocatalytic efficacy. The discussion extends to the applications of RP photocatalysts in environmental remediation and hydrogen generation. It critically assesses the strengths and shortcomings of prevalent synthesis techniques, including hydrothermal synthesis, ball milling, chemical vapor deposition (CVD), and physical vapor deposition (PVD). Hydrothermal synthesis is noted for its simplicity and cost-effectiveness, yet it grapples with issues of uniformity and scalability. Ball milling efficiently generates nanostructures but often leads to particle aggregation and suboptimal dispersion. CVD produces high-quality, precisely controlled films, albeit at the expense of requiring elevated temperatures and sophisticated equipment. PVD offers meticulous control over thin-film deposition but is hindered by high costs and limited suitability for large-scale production. In conclusion, the review explores RP’s potential as a sustainable and efficient photocatalyst for solar energy conversion, while delineating existing challenges and outlining prospective research trajectories in this domain.
A recent report from the Web of Science indicates that a total of 14067 articles were retrieved using the keywords “red phosphorus” and “red phosphorus-based catalysts” between 2014 and 2024. These articles received a total of 15, 449 citations (excluding self-citations), reflecting a year-on-year increase in research interest and activity (Fig. 1a). The majority of these publications originated from China (56.4%), the United States (13.6%), Germany (5.4%), India (4.8%), Australia (4.5%), Brazil (4.2%), and other countries (11.1%) (Fig. 1b).
A review of the literature on RP in the Web of Science database reveals key research hotspots since its discovery, as shown in Fig. 1c. These include photo/electrocatalysis, total hydrolysis, and various isomers. The figure illustrates the evolution of research focus on RP over time.
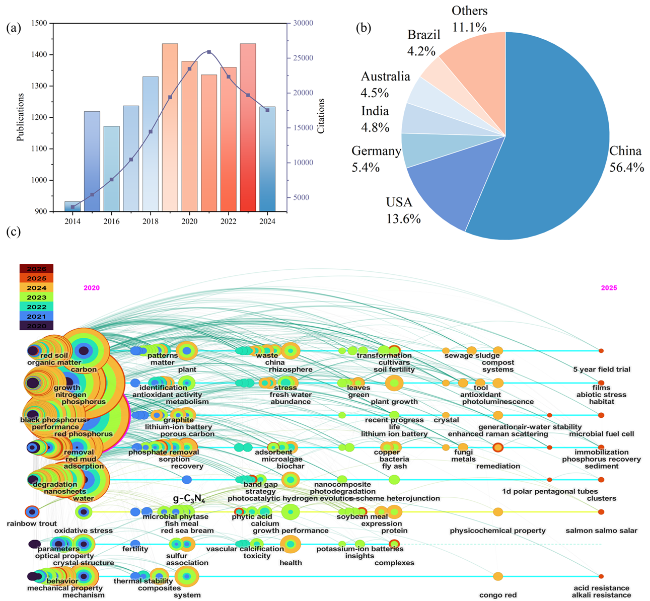
Fig. 1 (a) Number of citations and publications in Web of Science over time. (b) Percentage of publications from different countries. (c) Using “red phosphorus” as the key “title word”, set “publication year”, and search the “Web of Science” database to find out the evolution of the number of records of the literature published from 2020 to 2025. |
Despite significant advancements in the field of RP-based photocatalytic applications, several challenges remain to be addressed. The preparation processes are often complex, the materials lack sufficient stability, and the catalytic mechanisms are not yet fully understood, which has hindered their broader application. The aim of this review is to provide a comprehensive overview of the recent developments
in photocatalysis using elemental RP-based materials (Fig. 2).
in photocatalysis using elemental RP-based materials (Fig. 2).
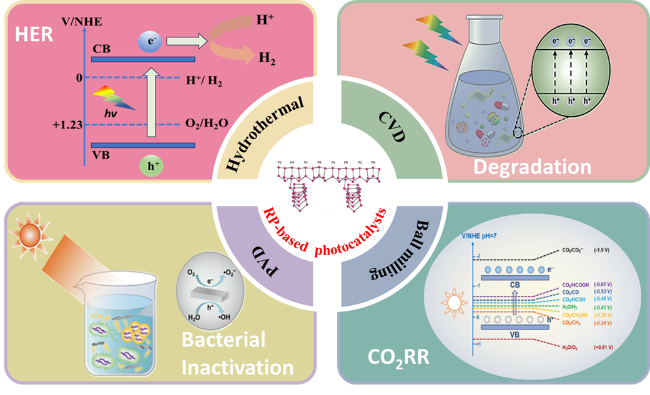
Fig. 2 Synthesis and photocatalytic applications of RP-based photocatalysts. |
To elucidate the underlying mechanisms of RP-based photocatalysts, we integrate the principles of DFT with advanced characterization techniques. This knowledge is then applied to guide the design of future RP materials. Our findings highlight the potential advantages of utilizing metal-free, monolithic RP materials in photocatalytic applications, showcasing their promise for enhancing efficiency and sustainability in photocatalysis [48-51].
2 Structure properties of RP
The history of the discovery of phosphorus is filled with both mystery and serendipity. In 1669, the German alchemist Hennig Brand accidentally discovered a substance that glowed in the dark while attempting to create gold by distilling urine [52-55]. Brand’s discovery marked the beginning of a new era in the study of chemical elements. However, the initial production of phosphorus proved to be a significant challenge, both in terms of difficulty and cost.
Over the following century, the properties of phosphorus were gradually elucidated, and by the mid-19th century, chemists turned their attention to the various allotropes of phosphorus (Fig 3a) [60]. In 1847, Austrian chemist Anton Schrötter succeeded in synthesizing RP by prolonging the heating of WP and controlling the rate at which it was cooled during a study of WP in Vienna. Fig. 3b illustrates the different atomic configurations of phosphorus allotropes and the corresponding synthesis routes [22]. The crystal structure of RP, however, was not determined by X-ray diffraction (XRD) until 1966, when V. H. Thurn and H. Krebs conducted these measurements [56-60].
2.1 Types and chemical structures of RP
Compared to WP and BP, the multiple isomers of RP present several challenges for its structural characterization. Early literature studies used Roman numerals to designate the various RP isomers, numbering them from I to V based on their thermal stability. Since the discovery of RP, there has been no consensus on its precise structural characteristics, leading to the proposal of several different morphologies, including amorphous and fibrous structures, for classification purposes [15-23,61 -64].
RP can exhibit a range of molecular structures, from cage-like to lattice structures, due to the triplet nature of the phosphorus atom [22-28]. In 1947, W. L. Roth and colleagues proposed that RP had five distinct allotropes, designated types I-V. Among these, the commercially available RP (type Ⅰ) is APR. Several possible linear molecular structures for ARP have been suggested in the literature, but its exact structure remains unclear. In 2019, Zhang et al. proposed a potential structure for ARP based on theoretical single-molecule elastic quantum computation (QM) and experimental measurements using monomolecular atomic force microscopy (AFM), revealing a zig-zag ladder structure for ARP [64-68].
Types II to V of RP are all crystalline. Type II is hexagonal, type III is metastable, type IV is triclinic, and type V is monoclinic. In 1966, V. H. Thurn and H. Krebs characterized the structure of type V RP using XRD, as originally described by W. Hittorf in 1865. As a result, type V RP is also known as violet phosphorus (VP) or Hittorf’s phosphorus (Fig 3c-e) [52,63].
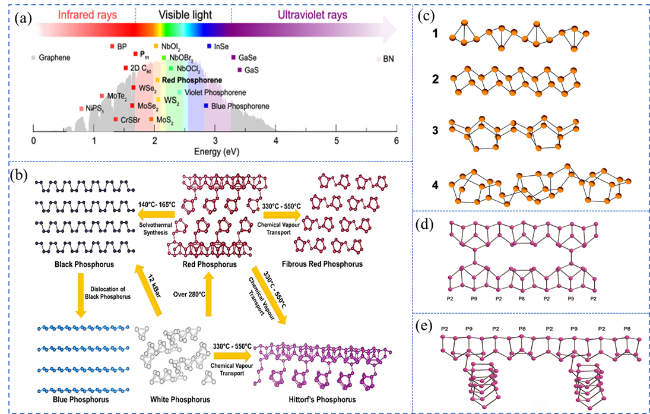
Fig. 3 (a) The absorption of light by RP and other 2D materials. Reproduced with promission. (b) Atomic structure of different P allotropes and the associated synthesis conditions. Reproduced with promission. (c) Four probable structural subunits of ARP. Reproduced with promission. Proposed atomic structure of (d) fibrous RP and (e) Hittorf’s P. (a) is adapted with permission from ref. 60 (Copyright 2020, Royal Society of Chemistry); (b) is reproduced with permission from ref. 22 (Copyright 2022, American Chemical Society); (c) is reproduced with permission from ref. 63 (Copyright 2019, Wiley-VCH); (d and e) are reproduced with permission from ref. 52 (Copyright 2010, American Chemical Society). |
2.2 Electronic structures of RP
The electronic structure and band gap are critical characteristics of RP semiconductors, determining their ability to absorb light and generate electron-hole pairs across the solar spectrum. RP is one of the few elements in nature that meets the stringent criteria for a narrow band gap, typically less than 3.0 eV. Specifically, RP semiconductors exhibit an energy band gap ranging from 1.70 to 2.0 eV, making them highly efficient for solar energy conversion by extending light absorption into the visible spectrum. This feature is particularly advantageous for optimizing solar energy utilization [26,53,60 -67,69,70].
Similar to other two-dimensional materials, RP undergoes a transition in its energy band structure when its bulk form is exfoliated into monolayers or single-layer systems. This transition shifts the material from an indirect to a direct band gap. When RP is transformed from a bulk structure into a monolayer sheet, it becomes a gap semiconductor. Calculations of the energy band structure reveal that the conduction band minimum (CBM) and valence band maximum (VBM) of RP are located at different reciprocal lattice points with high symmetry, indicating that RP is an indirect bandgap semiconductor in its bulk form. Additionally, bilayer and trilayer RP structures are also characterized as indirect bandgap semiconductors. The band gap of bulk RP is expected to fall within the range of 1.70 to 2.0 eV. Interestingly, a modest increase in the bandgap has been observed as the number of layers decreases. For example, the band gap increases from 1.99 eV in the bulk form to 2.02 eV in the trilayer configuration, 2.12 eV in the bilayer, and 2.39 eV in the monolayer. Despite this increase, the monolayer RP's direct bandgap has the potential to enhance solar energy conversion efficiency, though further exploration of the lattice dynamics governing charge-carrier transfer is needed. Moreover, the mobility of photogenerated electron-hole pairs may be significantly enhanced in monolayer RP due to the increased dispersion of the CB level in the monolayer nanosheets compared to the bulk, trilayer, and bilayer systems [62-75].
3 Synthesis strategies of RP-based photocatalysts
3.1 Hydrothermal
Hydrothermal synthesis is an advanced technique that utilizes high-temperature and high-pressure conditions within a sealed autoclave to drive material synthesis. In recent years, it has become a key method in photocatalyst research. By employing water or aqueous solutions as the reaction medium, this approach allows for controlled crystal growth and phase transitions under relatively mild thermal conditions, enabling the synthesis of materials with high crystallinity and tunable structural properties [55,82].
The hydrothermal method offers several notable advantages. Firstly, it operates under mild reaction conditions, which allows for the efficient synthesis of materials with low energy input. Secondly, it provides exceptional control over crystal morphology, allowing for precise tuning of reaction parameters such as temperature, pressure, and reaction time, enabling the optimization of material microstructures. Additionally, since water is the primary reaction medium, the hydrothermal process is environmentally sustainable, making it a green approach for material synthesis. This versatility makes the hydrothermal method highly suitable for the synthesis of a wide range of photocatalysts, including metal oxides, sulfides, phosphides, and composite materials, underscoring its broad applicability [81-88].
In the context of RP-based photocatalyst synthesis, the hydrothermal method offers distinct advantages. By optimizing reaction temperature, pressure, and solution composition, it significantly enhances the dispersion and specific surface area of RP, improving its photocatalytic efficiency. Moreover, the hydrothermal process facilitates the in-situ integration of RP with other semiconductors, enhancing interfacial interactions and improving the separation efficiency of photogenerated electron-hole pairs. These improvements collectively result in a significant enhancement of the material’s photocatalytic performance.
The hydrothermal method has been extensively employed to refine RP for superior catalytic performance. Jia et al. [85] subjected commercial RP to high-temperature and high-pressure conditions to eliminate surface oxides, followed by the in-situ incorporation of single metal atoms using a metal precursor (Fig. 4a-c). This approach optimized the material’s morphology, augmented its surface area and active sites, and markedly enhanced catalytic efficiency. Likewise, Wang et al. [86] utilized hydrothermal synthesis to produce nanoscale RP, subsequently integrating it with cubic MnSe2, resulting in exceptional hydrogen evolution performance (Fig. 4d-f). Despite its efficacy in regulating particle size and morphology, the hydrothermal method is not without drawbacks, including prolonged reaction durations, elevated energy demands, and the propensity for particle agglomeration.
Hydrothermal synthesis has also proven instrumental in the development of RP-based composite photocatalysts. For instance, an RP/ZnAl-layered double hydroxide (LDH) composite was fabricated through ultrasonic dispersion followed by hydrothermal treatment, yielding a seamlessly integrated heterostructure with significantly enhanced photocatalytic activity (Fig. 4g-i) [87]. Similarly, Zhao and co-workers [88] synthesized RP nanosheets by dispersing RP in water and subjecting it to hydrothermal processing under meticulously controlled conditions. The resultant nanosheets displayed expanded surface area and a greater abundance of active sites, with scanning electron microscopy (SEM) and transmission electron microscopy (TEM) analyses confirming successful structural optimization (Fig. 4j-l).
3.2 Ball milling
Ball milling is a widely used mechanical processing technique for material synthesis, offering several
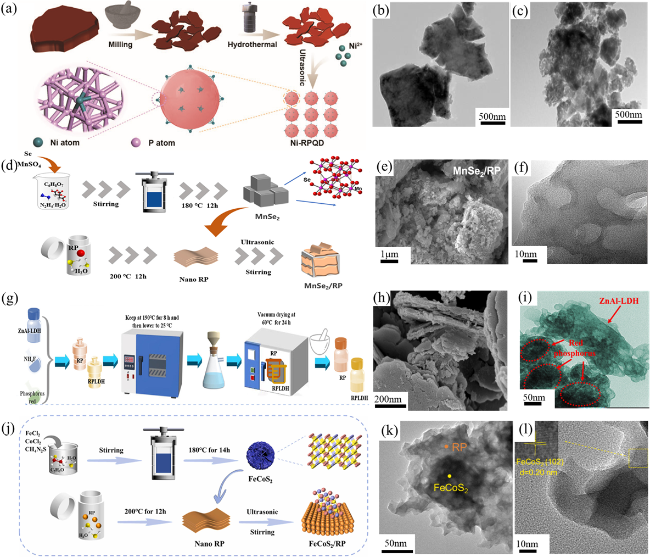
Fig. 4 (a) The hydrothermal synthesis strategy for Ni-RPQD photocatalysts. TEM images of (b) bulk RP and (c) hydrothermal RP. Reproduced with promission. (d) The hydrothermal synthesis strategy for MnSe2/RP photocatalysts. SEM image (e) and TEM (f) of 10 wt % MnSe2/RP. Reproduced with promission. (g) The hydrothermal synthesis strategy for RPLDH photocatalysts. SEM image (h) and TEM (i) of RPLDH0.8. Reproduced with promission. (j) The hydrothermal synthesis strategy for FeCoS2/RP. SEM image (k) and TEM image (l) of FeCoS2/RP. Reproduced with promission. (a-c) are adapted with permission from ref. 85 (Copyright 2023, Wiley-VCH); (d-f) are reproduced with permission from ref. 86 (Copyright 2024, American Chemical Society); (g-i) are reproduced with permission from ref. 87 (Copyright 2023, Elsevier); and (j-l) are reproduced with permission from ref. 88 (Copyright 2023, Elsevier.) |
advantages in the preparation of photocatalysts. This method involves intense collisions and friction between powder materials and milling balls within a ball mill, effectively reducing particle size, inducing phase transformations, and enhancing surface properties. Notably, ball milling is characterized by its simplicity, ease of operation, and low energy consumption, making it especially suitable for the synthesis of multi-component materials and doping modifications [89-91].
In the synthesis of photocatalysts, ball milling has proven to be effective in enhancing the specific surface area and dispersion of materials, thereby improving their photocatalytic performance. Through ball milling, different catalytic components can be uniformly mixed in a relatively short period. The high-energy collisions generated during the milling process also facilitate modifications to the crystal structure and the formation of new phases. Ball milling is widely used in the preparation of photocatalytic materials such as metal oxides, nitrides, and sulfides. Additionally, it has been successfully applied to the synthesis of composite photocatalysts, significantly enhancing the synergistic interactions between the different components [92-96].
Ball milling has proven to be highly effective in the preparation of RP-based photocatalysts. By facilitating the composite formation with other semiconductor materials, this method significantly enhances the dispersion of RP and strengthens interfacial interactions, thereby improving the separation efficiency of photogenerated charge carriers. Moreover, ball milling effectively prevents material agglomeration during the composite synthesis process, contributing to improved stability and catalytic efficiency. As a simple and efficient preparation technique, ball milling has emerged as a crucial approach for developing RP-based photocatalysts.
Ball milling has emerged as a highly effective strategy for modifying RP-based materials to enhance their catalytic and photothermal properties. In a study conducted by Ansari, RP was integrated with TiO2 through a 12 h ball milling process, which substantially improved its photocatalytic performance under visible light by promoting charge separation and transfer
(Fig. 5a-c) [22]. This approach presents a cost-effective and scalable alternative to plasmonic metals for visible-light-driven applications, offering significant potential for the development of advanced photocatalytic systems.
(Fig. 5a-c) [22]. This approach presents a cost-effective and scalable alternative to plasmonic metals for visible-light-driven applications, offering significant potential for the development of advanced photocatalytic systems.
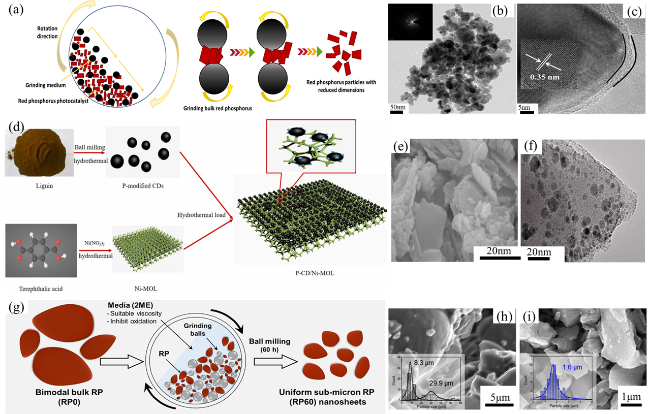
Fig. 5 (a) Ball milling synthesis strategy. (b) TEM image and (c) HR-TEM image of the RP-TiO2-12h. Reproduced with promission. (d) The schematic diagram of synthetic route. (e) SEM image and (f) HR-TEM image of the P(1.0)-CD/Ni-MOL. Reproduced with promission. (g) Ball milling synthesis strategy. SEM images of (h) RP30, and (i) RP60. Reproduced with promission. (a-c) are adapted with permission from ref. 22, 94 (Copyright 2022, 2016, American Chemical Society, Science); (d-f) are reproduced with permission from ref. 95 (Copyright 2022, Elsevier); and (g-i) are reproduced with permission from ref. 96 (Copyright 2023, Elsevier). |
Ma et al. reported the synthesis of a phosphorus-doped carbon quantum dot/nickel metal-organic layer (CD/Ni-MOL) heterojunction photocatalyst via RP-assisted ball milling followed by hydrothermal treatment (Fig. 5d) [95]. Their study demonstrated that the partial embedding of carbon quantum dots within the Ni-MOL framework (Fig. 5e-f) significantly enhanced photocatalytic degradation and mineralization efficiency. These findings underscore the potential of phosphorus-doped materials in photocatalysis, highlighting their ability to facilitate charge separation and promote reactive species generation for efficient pollutant degradation.
Shridharan et al. developed a ball-milling strategy to synthesize RP nanosheets with tunable morphology and size by precisely controlling the milling duration
(Fig. 5g-i) [96]. Their results revealed that the optimized RP60 exhibited a defect-rich nanosheet structure, which significantly enhanced its photothermal performance. Further improvements in solar steam generation were achieved by incorporating a porous polyurethane support and plasmonic resonance-heating silver nanoparticles, thereby maximizing light absorption and heat localization. Despite these advancements, challenges persist in ensuring the long-term stability, high-temperature durability, and cost-effectiveness of these materials. Future research should focus on optimizing structural design and material integration to achieve a balance between efficiency, stability, and economic viability for large-scale applications.
(Fig. 5g-i) [96]. Their results revealed that the optimized RP60 exhibited a defect-rich nanosheet structure, which significantly enhanced its photothermal performance. Further improvements in solar steam generation were achieved by incorporating a porous polyurethane support and plasmonic resonance-heating silver nanoparticles, thereby maximizing light absorption and heat localization. Despite these advancements, challenges persist in ensuring the long-term stability, high-temperature durability, and cost-effectiveness of these materials. Future research should focus on optimizing structural design and material integration to achieve a balance between efficiency, stability, and economic viability for large-scale applications.
3.3 PVD
PVD is a thin-film deposition technique that involves transforming source materials from solid or liquid states into a gaseous phase, followed by deposition onto a substrate. It is widely employed for fabricating uniform, high-purity thin films. The primary advantages of PVD include precise control over film thickness and composition, relatively low processing temperatures, and versatility across various material systems. However, PVD’s efficiency can be limited when dealing with substrates of complex geometries or achieving uniform deposition over large areas. Additionally, the high cost of PVD equipment can restrict its broader application in some fields [97-100].
In the synthesis of RP-based photocatalysts, PVD offers significant advantages through its ability to precisely control deposition at the atomic or molecular level. This allows for fine-tuning of film thickness, crystallinity, and morphology to optimize photocatalytic performance. Furthermore, PVD facilitates the doping of RP with metals or nonmetals, enhancing visible-light absorption and improving charge separation efficiency. However, due to the low melting point and high oxidation susceptibility of RP, strict process control is necessary to avoid material degradation or performance loss [32-36]. These challenges make PVD a promising yet technically demanding approach for advancing RP-based photocatalysts, offering opportunities for further optimization.
Recent advancements in RP-based materials have underscored their immense potential in photocatalysis and electrochemical nitrogen fixation. Lin and co-workers developed a SiO2/crystalline red phosphorus (CRP) photocatalyst using a sublimation-deposition method, in which nanosized CRP was deposited onto optically inactive SiO2 nanospheres (Fig. 6a-b) [100]. During this process, the in situ carbonization of surfactants within the SiO2 nanospheres led to the formation of a carbonaceous phase that effectively modified RP, thereby significantly enhancing its photocatalytic nitrogen fixation efficiency. This strategy presents a scalable and facile approach for designing high-performance photocatalysts, offering new avenues for optimizing RP-based materials in sustainable energy and environmental applications.
Liu and co-workers synthesized few-layer triclinic CRP nanoribbons (NRs) using an iodine-assisted PVD method, followed by probe ultrasonic exfoliation to obtain high-aspect-ratio NRs (Fig. 6c-d) [101]. These CRP NRs achieved an impressive ammonia yield of 15.4 μg h-1mgcat -1 and a Faradaic efficiency of 9.4% in a neutral electrolyte under ambient conditions, highlighting their potential as highly efficient electrocatalysts for the nitrogen reduction reaction (NRR). Despite these promising results, further research is needed to address challenges related to material stability, large-scale synthesis, and long-term catalytic performance under practical operating conditions, ensuring their viability for real-world applications.
A solid-state synthesis method was employed to fabricate fibrous red phosphorus (FRP), a crystalline allotrope with a distinctive urchin-like morphology and promising photocatalytic properties [102]. To further enhance its photocatalytic efficiency, FRP was integrated with TiO2 nanofibers (NFs) via PVD, forming a heterostructure that significantly improved charge separation and reactive oxygen species (ROS) generation (Fig. 6e-f). The TiO2/FRP composite, synthesized through a sequential process involving hydrothermal treatment, ultrasonic dispersion, freeze-drying, and low-pressure thermal processing, exhibited outstanding photocatalytic performance under solar irradiation. The optimized band alignment and structural stability of FRP contributed to its enhanced activity, highlighting the potential of FRP-based heterostructures for solar-driven catalytic applications.
3.4 CVD
CVD is a versatile and widely utilized technique for material synthesis, particularly in the preparation and modification of photocatalysts. The method involves introducing gaseous precursors into a reaction chamber under controlled conditions, where they undergo chemical reactions or decomposition to deposit solid-state materials onto substrates. Due to its ability to produce high-purity, structurally tailored materials, CVD has gained significant attention in the field of photocatalysis [103,104].
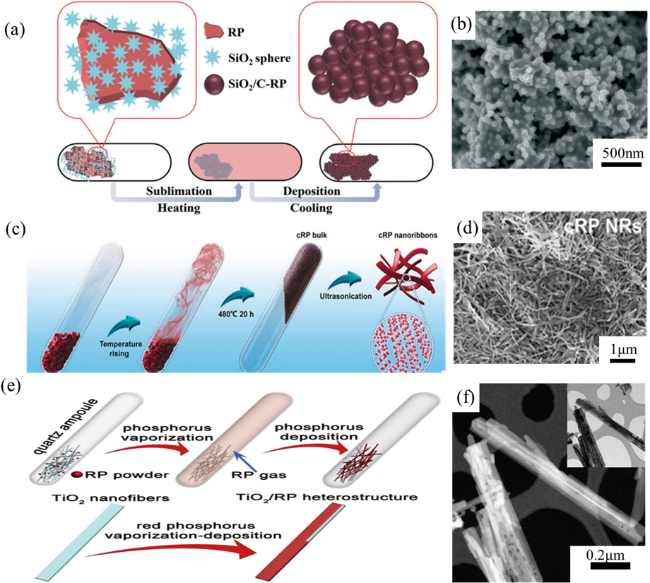
Fig. 6 (a) Schematic illustration for the preparation of SiO2/C-RP. (b) SEM image of SiO2/C-RP. (c) Synthesis of CRP bulk and nanoribbons. (d) SEM images of CRP NRs. (e) Schematic illustration for the preparation of TiO2/RP. (f) STEM image of TiO2/RP. (a and b) are adapted with permission from ref. 100 (Copyright 2020, Royal Society of Chemistry); (c and d) are reproduced with permission from ref. 101 (Copyright 2020, Wiley-VCH); and (e and f) are reproduced with permission from ref. 102 (Copyright 2019, Elsevier). |
CVD has shown great promise in the synthesis and enhancement of RP-based photocatalysts, offering key advantages such as uniform dispersion to minimize agglomeration, improved interfacial charge transfer through in-situ integration with secondary semiconductors, and tailored morphologies that enhance light absorption and catalytic performance [105-108]. However, its application is constrained by several challenges, including the thermal sensitivity of RP, which limits the operating conditions; the high energy demands and complexity of CVD equipment, which restrict scalability; and the technical difficulty of identifying safe and effective phosphorus-based precursors for deposition [109-112].
Wu et al. synthesized dendritic elemental RP photocatalysts via a CVD method, utilizing bismuth as a co-catalyst to regulate crystal phases and morphology, resulting in efficient charge transfer and hydrogen evolution performance (Fig. 7a-c) [110]. While this approach offers significant improvements in material performance, it faces challenges. The scalability and cost of the CVD method may limit its broader application. Additionally, the stability and durability of RP, particularly under real-world conditions, require further validation. The environmental impact and sustainability of bismuth as a co-catalyst also need to be addressed. Despite these challenges, this strategy offers promising prospects for photocatalyst design, with overcoming issues related to material stability, cost, and environmental compatibility being essential for widespread use.Dong et al. developed RuCu/CRP composite photocatalysts through a multi-step process, with CVD playing a pivotal role. RuCu alloy nanoparticles were initially synthesized via a co-reduction method, followed by the conversion of ARP to CRP using CVD. The RuCu nanoparticles were then impregnated onto CRP and calcined in hydrogen to form the RuCu/CRP composites, which exhibited enhanced catalytic properties (Fig. 7d) [111]. The CVD process facilitated the synthesis of high-purity CRP with an optimal morphology, thereby improving catalytic performance. TEM analysis further revealed the uniform distribution of RuCu nanoparticles and lattice spacings corresponding to Ru-Cu and CRP facets, confirming the successful formation of the composite and its structural integrity (Fig. 7e-f).
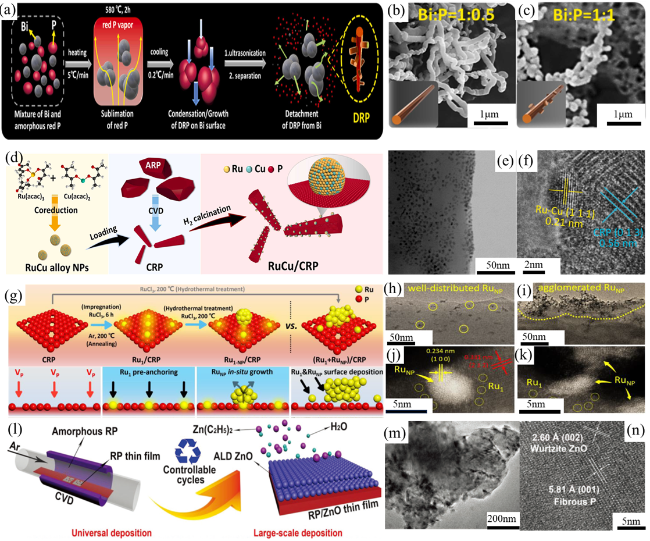
Fig. 7 (a) The CVD synthetic procedure of the DRP products. SEM images of (b-c) DRP. Reproduced with promission. (d) Schematic synthesis strategy of RuCu/CRP. TEM image (e) and HR-TEM image (f) of RuCu/CRP. Reproduced with promission. (g) Schematic synthesis strategy of Ru1/CRP, Ru1-NP/CRP, and (Ru1+RuNP)/CRP. TEM images of (h) Ru1-NP/CRP, and (i) (Ru1+RuNP)/CRP. HAADF-STEM images of (j) Ru1-NP/CRP, and (k) (Ru1+RuNP)/CRP. Reproduced with promission. (l) Schematic synthesis strategy of RP/ZnO. TEM images of (m) and HR-TEM image (n) of Ti-RP/ZnO. Reproduced with promission. (a-c) are adapted with permission from ref. 110 (Copyright 2022, Elsevier); (d-f) are reproduced with permission from ref. 111 (Copyright 2024, Elsevier); (g-k) are reproduced with permission from ref. 112 (Copyright 2024, Wiley-VCH); and (l-n) are reproduced with permission from ref.113 (Copyright 2019, Wiley-VCH). |
Bian et al. developed an innovative co-functionalization strategy by simultaneously incorporating ruthenium single atoms (Ru1) and nanoparticles (RuNP) into CRP to significantly enhance photocatalytic hydrogen evolution performance. Through precise atomic engineering, Ru1 atoms were strategically anchored at defect sites on the CRP matrix, which not only facilitated the in-situ nucleation and growth of RuNP but also established efficient charge transfer pathways (Fig. 7g-k) [112]. This dual-functional catalyst architecture demonstrated remarkable improvements in multiple aspects: (a) enhanced interfacial charge migration efficiency, (b) prolonged lifetime of photogenerated charge carriers, and (c) superior catalytic stability, collectively contributing to the dramatically increased hydrogen evolution rate and operational durability. In a parallel development, Li and colleagues employed advanced vapor deposition techniques to fabricate RP/ZnO heterostructure thin films. By combining CVD with atomic layer deposition (ALD), they achieved exceptional film uniformity and substrate compatibility, making this approach particularly promising for large-scale photocatalytic applications (Fig. 7l-n) [113]. However, the researchers noted that the practical implementation of this methodology still faces challenges, primarily related to the high equipment costs and inherent complexity of the deposition processes, which may limit its widespread adoption in industrial settings.
The CVD method holds great potential for fabricating RP-based photocatalysts due to its ability to precisely control film thickness and uniformity, along with its compatibility with various substrates, making it suitable for large-scale applications. Through CVD, the photocatalytic performance of RP can be effectively enhanced, particularly in terms of improving the separation and transport of photogenerated charges. However, challenges such as equipment costs and process complexity still need to be addressed for broader applications.
4 Structural characterization techniques of RP-based photocatalysts
A comprehensive structural analysis of RP-based photocatalysts is crucial for understanding their intrinsic physical properties, surface morphology, and interfacial interactions with composite components [114-120]. Advanced characterization techniques, offering a broad range of spatial resolutions and analytical capabilities, are utilized to investigate structural attributes at multiple scales-from bulk material properties to nanoscale features. This multifaceted approach provides a deeper insight into the relationship between structural characteristics and photocatalytic performance, enabling the rational design and optimization of RP-based materials for improved functionality [121-126].
4.1 AFM
Atomic Force Microscopy (AFM) is a powerful nanoscale imaging tool widely used for surface characterization. By utilizing the interaction forces between a sharp probe tip and the sample surface, AFM scans the surface to generate high-resolution topographical images with sub-nanometer precision. Unlike optical or electron microscopy, AFM does not rely on lenses or electron beams, making it applicable to a broad range of materials, including insulators, semiconductors, and biological specimens [127-131]. Its versatility and ability to capture intricate surface details make AFM an indispensable technique for advanced material analysis [132-135].
4.2 KPFM
Kelvin Probe Force Microscopy (KPFM), an extension of AFM, is a powerful technique for analyzing the surface potential distribution at the nanoscale [136-141]. By measuring the contact potential difference (CPD) between a conductive probe and the sample surface, KPFM reveals critical local electronic properties, such as work function, Fermi level, and charge distribution. The method involves applying an alternating current (AC) voltage to the probe during surface scanning, while a direct current (DC) feedback voltage compensates for the electrostatic force, enabling precise mapping of the CPD with high spatial and voltage sensitivity. KPFM is extensively used in the investigation of semiconductors, photovoltaic materials, and photocatalysts, offering essential insights into their electronic structures and charge transfer dynamics [142-147].
Chen et al. employed AFM (Fig 8a) and KPFM
(Fig 8b) to examine the electron transfer dynamics between bulk RP and RP nanosheets (RP NS) [148]. AFM images revealed structural differences between bulk RP and RP NS, confirming the formation of a composite structure with distinct surface morphologies. KPFM measurements indicated a potential difference between the two forms of RP, with the ultra-thin RP nanosheets exhibiting a lower potential than the bulk RP. This potential difference facilitated the transfer of photogenerated electrons from bulk RP to RP nanosheets, which was critical for enhancing photocatalytic performance. The optimized energy band structure and surface potential at the interface effectively promoted electron migration, leading to an improved hydrogen production rate and stability over multiple cycles. Thus, AFM and KPFM not only confirmed the structural features but also provided direct evidence of the electron interactions that play a crucial role in enhancing photocatalytic performance.
(Fig 8b) to examine the electron transfer dynamics between bulk RP and RP nanosheets (RP NS) [148]. AFM images revealed structural differences between bulk RP and RP NS, confirming the formation of a composite structure with distinct surface morphologies. KPFM measurements indicated a potential difference between the two forms of RP, with the ultra-thin RP nanosheets exhibiting a lower potential than the bulk RP. This potential difference facilitated the transfer of photogenerated electrons from bulk RP to RP nanosheets, which was critical for enhancing photocatalytic performance. The optimized energy band structure and surface potential at the interface effectively promoted electron migration, leading to an improved hydrogen production rate and stability over multiple cycles. Thus, AFM and KPFM not only confirmed the structural features but also provided direct evidence of the electron interactions that play a crucial role in enhancing photocatalytic performance.
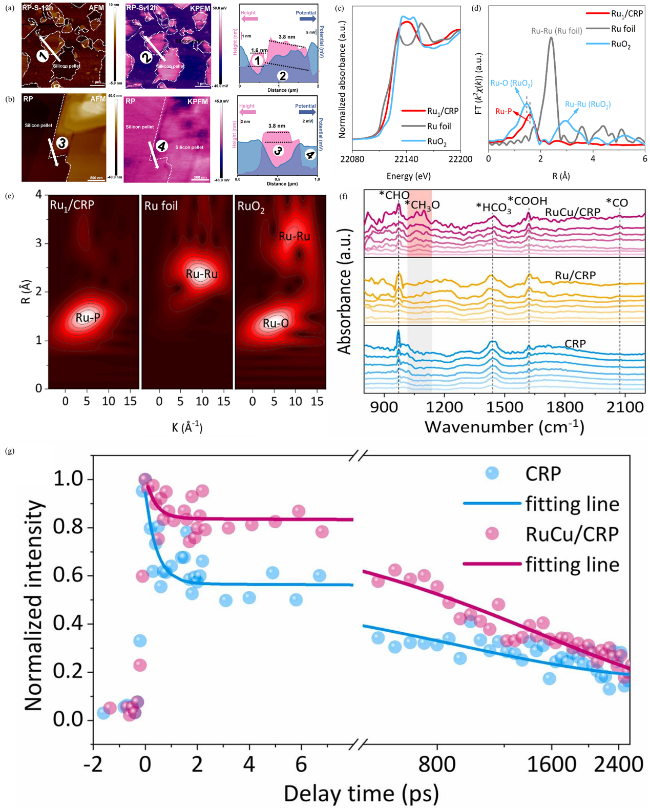
Fig. 8 AFM images, KPFM images (a) RP-S-12 h and (b) bulk RP. Reproduced with promission. (c) Ru K-edge XANES profile, (d) Fourier-transform EXAFS spectra in R space, and (e) wavelet transform EXAFS spectra of Ru1/CRP, Ru foil, and RuO2. Reproduced with promission. (f) in-situ DRIFTS spectra of the CRP, Ru/CRP, and RuCu/CRP samples. (g) Normalized fs-TA decay kinetics plots with exponential fitting curves of CRP and RuCu/CRP probed at 650 nm under 343 nm laser excitation. Reproduced with promission. (a and b) are adapted with permission from ref. 148 (Copyright 2022, Elsevier); (c-e) are reproduced with permission from ref. 112 (Copyright 2024, Wiley-VCH); and (f and g) are reproduced with permission from ref.111 (Copyright 2024 Elsevier). |
4.3 XANES
X-ray Absorption near edge structure (XANES) is a spectroscopic technique used to investigate the local electronic structure and chemical states of specific elements within a material. As a subset of X-ray absorption spectroscopy (XAS), XANES focuses on the near-edge region of the absorption spectrum, typically within 50 eV of the absorption edge [149-154]. Detailed analysis of this region provides essential information about the oxidation states, coordination environments, and electronic transitions of the target element, making it an invaluable tool for understanding material properties.
4.4 EXAFS
Extended X-ray absorption fine structure (EXAFS) is an advanced spectroscopic technique that provides detailed insights into the local atomic environment of materials. As part of XAS, EXAFS analyzes oscillations in the absorption spectrum beyond the absorption edge, typically extending several hundred electron volts [155-160]. These oscillations result from interference between outgoing photoelectrons and those scattered by neighboring atoms. EXAFS yields critical structural information, including bond distances (the spacing between the absorbing atom and its neighbors), coordination numbers (the number of neighboring atoms), and insights into structural disorder and thermal effects, reflecting changes in the material due to atomic vibrations.
4.5 in-situ DRIFTS
In-situ diffuse reflectance infrared Fourier transform spectroscopy (DRIFTS) is a powerful technique for monitoring surface reactions and chemical transformations in real-time under operational conditions. Unlike conventional infrared spectroscopy, DRIFTS captures the diffuse reflectance of infrared light from powdered or rough sample surfaces, making it especially suitable for studying heterogeneous catalysts and solid materials [161-165]. The “in-situ” capability allows measurements during exposure to controlled environments, such as varying temperature, pressure, and reactant gases, providing real-time insights into surface chemical processes.
This technique is particularly valuable for examining interactions between reactants and photocatalysts, including adsorption and desorption phenomena, surface chemistry changes, and charge carrier dynamics during photocatalytic reactions [37-41,165]. DRIFTS is widely used in catalytic studies, environmental monitoring, and energy research, offering essential information on reaction mechanisms and material behavior under practical conditions.
Bian et al. employed XANES and EXAFS spectroscopy to confirm the successful embedding of Ru1 at the VP in CRP, which is essential for enhancing photocatalytic hydrogen evolution (PHE) performance (Fig. 8c-e) [112]. XANES analysis revealed that Ru1 in CRP has an average valence state between 0 and +4, consistent with a single-atom configuration, rather than metallic Ru or RuO2. EXAFS spectroscopy further supported this finding, showing a Ru-P bond at 1.61 Å, confirming P coordination without the presence of metallic Ru. These two techniques collectively provide direct structural and electronic evidence for the successful incorporation of Ru1 at the VP sites, which facilitates defect repair and effective charge carrier migration, ultimately improving photocatalytic efficiency and stability.
4.6 fs-TA
Femtosecond transient absorption spectroscopy (fs-TA) is an ultrafast technique designed to investigate the dynamic behavior of excited states in materials with femtosecond (10-15 second) time resolution [166]. Using a pump-probe configuration, fs-TA excites the sample with a pump pulse to generate transient species, while a time-delayed probe pulse tracks changes in the absorption spectrum as these excited states evolve over time.
This approach provides valuable insights into the lifetimes and relaxation dynamics of excited states, charge carrier behavior, energy transfer pathways, and the formation of intermediate species. By resolving these ultrafast processes, fs-TA uncovers detailed photophysical and photochemical mechanisms that define material properties.
Fs-TA is particularly effective for photocatalytic systems, enabling real-time observation of photogenerated charge carriers, such as electrons and holes, as well as their recombination and transport dynamics. In RP-based photocatalysts, fs-TA can reveal charge separation and transfer mechanisms at heterojunction interfaces, offering critical guidance for enhancing photocatalytic performance [167-172].
Dong et al. used fs-TA and in-situ DRIFTS analyses to elucidate the mechanism by which RuCu/CRP photocatalysts enhance CO2 reduction performance
(Fig. 8f-g) [111]. The fs-TA measurements revealed the process of charge carrier migration, indicating that the incorporation of RuCu alloy effectively extended the lifetime of charge carriers and reduced charge recombination. This prolonged charge lifetime played a decisive role in enhancing photocatalytic activity, thus promoting CH4 generation. Meanwhile, in-situ DRIFTS analysis identified the key intermediates formed during the CO2 reduction process, further showing that the addition of Cu altered the reaction pathway and facilitated the formation of *CH3O, a critical intermediate for CH4 synthesis. By combining these two characterization techniques, the study verified the synergistic effect of the RuCu alloy, optimizing charge carrier separation, improving reaction efficiency, and steering the CO2 reduction process toward the CH4 synthesis pathway, significantly surpassing the performance of current elemental phosphorus-based photocatalysts.
(Fig. 8f-g) [111]. The fs-TA measurements revealed the process of charge carrier migration, indicating that the incorporation of RuCu alloy effectively extended the lifetime of charge carriers and reduced charge recombination. This prolonged charge lifetime played a decisive role in enhancing photocatalytic activity, thus promoting CH4 generation. Meanwhile, in-situ DRIFTS analysis identified the key intermediates formed during the CO2 reduction process, further showing that the addition of Cu altered the reaction pathway and facilitated the formation of *CH3O, a critical intermediate for CH4 synthesis. By combining these two characterization techniques, the study verified the synergistic effect of the RuCu alloy, optimizing charge carrier separation, improving reaction efficiency, and steering the CO2 reduction process toward the CH4 synthesis pathway, significantly surpassing the performance of current elemental phosphorus-based photocatalysts.
5 Theoretical simulations
DFT calculations offer significant advantages in the study of catalytic materials, particularly in the analysis of electronic interactions at the level of individual atomic sites. Firstly, DFT calculations can provide high-precision electronic structure information, thus assisting researchers in attaining a more profound comprehension of the electronic distributions and interactions between single-atom sites and surrounding atoms. Secondly, DFT calculations can predict the stability and reaction paths of catalytic materials under different reaction conditions, thereby elucidating the pivotal role played by single-atom sites in the catalytic process. Through this theoretical analysis, researchers can design catalysts with enhanced catalytic activity and selectivity, thus improving the efficiency and sustainability of industrial applications [173-179]. Consequently, the application of DFT calculations in catalytic materials science provides a robust theoretical foundation and guidance for the development of new and efficient catalysts.
5.1 Electronic structure calculations
Electronic structure calculations are an essential theoretical foundation in photocatalysis research, used to analyze materials’ band structures, density of states (DOS), and band edge positions to evaluate their photocatalytic activity (Fig 9a-g) [180]. Calculations based on DFT indicate that RP is a narrow-bandgap semiconductor (~1.4-2.2 eV), capable of absorbing visible light and generating photo-induced charge carriers. However, standard DFT often underestimates the bandgap, and therefore, methods such as the HSE06 exchange-correlation functional or the GW approximation are typically employed to refine the results. These calculations are also crucial for studying the effects of doping (both metal and non-metal), surface modifications, and defect engineering on the electronic structure of RP [66-72].
5.2 Optical absorption and photoresponse analysis
The optical absorption characteristics of RP-based photocatalysts are critical for their performance under visible light irradiation. Time-dependent density functional theory (TDDFT) can be utilized to simulate the absorption spectra and analyze the material’s optical transition properties and response range. Furthermore, calculating the dielectric function, absorption coefficient, and refractive index provides additional insights into the light-harvesting efficiency and photo-excitation dynamics of RP-based photocatalysts. Theoretical studies indicate that the layered structure of RP promotes stronger light absorption, and strategies such as impurity level introduction or heterojunction formation can broaden the absorption range and enhance the utilization of visible light [17-25,172,185].
5.3 Interface and heterojunction simulations
Constructing heterojunctions is a highly effective strategy for enhancing charge carrier separation and preventing electron-hole recombination in RP-based photocatalysts [182-188]. First-principles calculations are instrumental in studying interfacial charge transfer, Fermi level alignment, and work function differences, providing valuable insights into the electronic structure and charge transport mechanisms at the heterojunction (Fig 9h) [181]. Techniques such as charge density difference analysis, Bader charge analysis, and energy distribution calculations further elucidate the electronic interactions and charge transfer pathways at the interface.
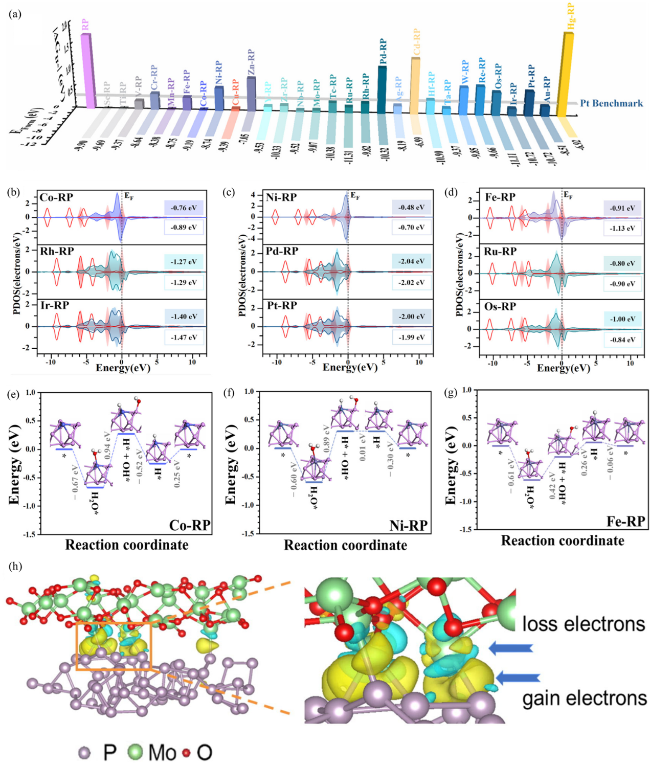
Fig. 9 (a) The cube columns represent |ΔGH*|, and the shadows indicate the corresponding formation energy (EForm) of pristine RP and 29 types of TM-RP SACs. (b-d) The d-band center positions of TM-RP before (color-filled) and after (color-framed) H2O adsorption calculated via density of states (DOS). The reaction energy changes of the key steps in the HER during water splitting on (e) Co-RP, (f) Ni-RP and (g) Fe-RP. Reproduced with promission. (h) Charge difference map of P-MoO2 and P-MoO2-CO2. Reproduced with promission. (a-g) are adapted with permission from ref. 180 (Copyright 2024, Royal Society of Chemistry), and (h) is reproduced with permission from ref.181 (Copyright 2025 Elsevier). |
Through comprehensive theoretical calculations, the electronic and optical properties of RP-based photocatalysts can be optimized, offering a scientific basis for the design of novel and efficient photocatalytic systems.
6 Applications of RP in photocatalysis
A photocatalytic reaction is defined as a chemical reaction in which electrons in the VB are excited and jump from the VB to the CB to form photogenerated electrons and photogenerated holes in the CB and VB, respectively [34-52]. This occurs when a semiconductor absorbs energy greater than or equal to its forbidden band width. A proportion of the photogenerated electrons and holes are incorporated into the semiconductor and dissipated as heat and other forms of energy. The remaining photogenerated electrons and holes with strong redox capacity migrate to the semiconductor surface, where they participate in a series of photocatalytic reactions, including hydrogen evolution, CO2 reduction, bacterial disinfection and pollutant degradation [12-18,189 -194].
6.1 Photocatalytic for hydrogen production
The photocatalytic decomposition of water to generate clean hydrogen is considered one of the most promising solutions to address the global energy crisis and environmental challenges. The main goal is to design and develop semiconductor photocatalysts with appro priate energy band structures to efficiently utilize solar energy for water oxidation and reduction, while achieving high quantum yields and long-term stability. Phosphorus-based materials, especially CRP-based materials, have garnered significant interest due to their narrow bandgap, low cost, and abundant availability [195-200]. Additionally, these materials have a visible light absorption range extending up to 700 nm, making them suitable for harnessing solar energy for photocatalytic hydrogen production. However, the slow charge transfer rate and rapid recombination of photogenerated electron-hole pairs limit the effectiveness of RP in photocatalytic applications. This section will discuss and assess recent advancements in the development of RP-based materials for hydrogen production via photocatalysis [100-112].
Bian et al. pioneered the integration of ruthenium single atoms (Ru1) with ruthenium nanoparticles (RuNP) in CRP, leading to a substantial enhancement in photocatalytic hydrogen evolution (PHE) efficiency [112]. By strategically anchoring Ru₁ at the defect sites within CRP, the researchers effectively addressed inherent defects, minimizing charge deep trapping and extending the lifetime of active charge carriers. The optimized Ru1-NP/CRP catalyst achieved a photocatalytic hydrogen evolution rate of 3175 μmol h-1 g-1, which is 454 times greater than bare CRP and 15 times higher than Ru₁/CRP, demonstrating exceptional catalytic performance (Fig. 10a-b). This study highlights the pivotal role of metal single atom integration and presents a novel approach for sustainable hydrogen production with substantial potential for various applications.
Wang et al. achieved a significant enhancement in photocatalytic hydrogen production by constructing an S-scheme heterojunction with MnSe2/RP composite materials [86]. Experimental results showed that under 300 W xenon lamp irradiation, the hydrogen production rate of the 5 wt% MnSe2/RP composite reached 940 μmol g-1 h-1, representing increases of 3.5 times and 22 times compared to pure RP and MnSe2, respectively (Fig. 10c-d). This improvement is attributed to the effective charge separation capability of the heterojunction, which reduces charge recombination and boosts the efficiency of the photocatalytic reaction. Additionally, the composite exhibited good stability in multiple cycling experiments, suggesting its potential for practical applications. These findings provide valuable theoretical insights and practical guidance for further research on RP-based catalysts in the field of photocatalytic hydrogen production.
Huang et al. successfully synthesized RP-modified TiO2 hollow sphere heterostructures using a CVD method to enhance their performance in photocatalytic hydrogen production [201]. In their experiment, SiO2 nanospheres were first synthesized as templates, followed by the preparation of TiO2 hollow spheres. Finally, RP was integrated with TiO2 to form the TiO2@RP heterostructure. This catalyst achieved a hydrogen production rate of 215.5 μmol g-1 h-1 under simulated solar light, significantly outperforming both pure RP and TiO2 (Fig. 10e-f).
The enhanced performance can be attributed to the incorporation of RP, which broadened the light absorption spectrum. Additionally, the heterojunction formed between TiO2 and RP effectively facilitated the separation and migration of photogenerated charge carriers, reducing recombination rates and significantly improving the efficiency of the photocatalytic reaction. This study provides new insights and methodologies for the development of efficient photocatalysts.
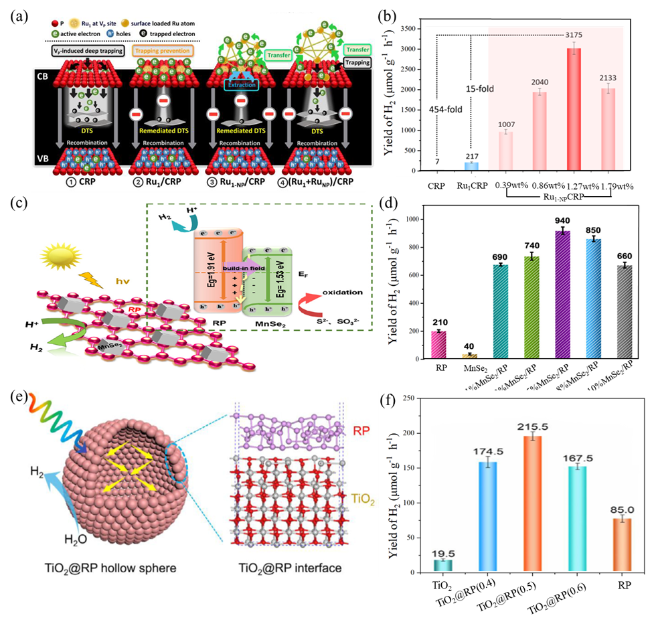
Fig. 10 (a) Schematic illustration of the proposed charge dynamics. (b)Visible light PHE rates of CRP, Ru1/CRP, and the Ru1-NP/CRP samples with different Ru contents. Reproduced with promission. (c) Schematic illustration of the proposed charge dynamics. (d) Rates of pure RP, pure MnSe2, and x wt % MnSe2/RP. Reproduced with promission. (e) Suggested mechanism for photocatalytic hydrogen generation using TiO2@RP. (f) Photocatalytic hydrogen production activities. Reproduced with promission. (a and b) are adapted with permission from ref. 112 (Copyright 2024, Wiley-VCH); (c and d) are reproduced with permission from ref. 86 (Copyright 2024, American Chemical Society); and (e and f) are reproduced with permission from ref.201 (Copyright 2022, Elsevier). |
RP-based photocatalysts exhibit immense potential in the field of photocatalytic hydrogen evolution; however, several challenges remain. Enhancing charge separation efficiency, optimizing the band structure, and improving light absorption capabilities are critical directions for further enhancing catalytic performance. Moreover, integrating RP-based catalysts with other functional materials, such as single-atom catalysts, cocatalysts, and conductive substrates, holds promise for achieving synergistic performance enhancement. Additionally, the development of green, cost-effective, and scalable synthesis methods will facilitate the practical application of RP-based catalysts. Future research should focus on integrating material design with mechanistic studies to provide theoretical guidance and technical support for achieving efficient, stable, and sustainable photocatalytic hydrogen production.
6.2 Photocatalytic for CO2 reduction
The excessive emission of CO2 into the atmosphere is a key driver of environmental challenges, including the greenhouse effect. Current research efforts are focused on developing stable and efficient methods for CO2 conversion. Photocatalytic CO2 reduction technology offers a promising solution by addressing the dual challenges of environmental sustainability and energy security. This technology converts CO2 into valuable fuels while promoting carbon recycling. Its advantages include mild reaction conditions (room temperature, atmospheric pressure, and light-driven processes), high CO2 conversion efficiency, and effective carbon recycling, positioning it as an optimal approach for CO2 utilization [202-211].
However, conventional photocatalysts often face limitations such as low charge separation efficiency and insufficient catalytic activity, which hinder their overall performance. In this context, RP-based photocatalysts have emerged as a promising alternative due to their unique properties, including a suitable bandgap (~1.42 eV) for visible-light absorption, high chemical stability, and environmental friendliness. By leveraging these advantages, RP-based catalysts can enhance charge separation and facilitate the efficient reduction of CO2 to high-value products, making them a key focus in advancing photocatalytic CO2 conversion technology [43-55].
RP-based photocatalysts are considered promising candidates for CO2 reduction due to their unique advantages in light absorption and charge separation. As highlighted in the study by Dong et al., incorporating metal alloy nanoparticles, such as RuCu alloy, into CRP significantly enhances CO2 reduction efficiency and product selectivity. This composite system leverages synergistic effects to improve charge separation and increase the utilization of active sites, achieving a notable CH4 selectivity of 96% and a significant improvement in yield (Fig. 11a-b) [111]. While the study demonstrates impressive CH4 production performance, its originality is somewhat limited. The work provides insufficient insight into the catalytic mechanism and overlooks critical considerations regarding practical feasibility and scalability, which constrains its contribution to advancing photocatalytic CO2 conversion technologies.
Fung et al. developed an advanced dual Z-scheme photocatalytic system featuring mixed-phase RP/BP and WO3 for efficient CO2 reduction. This system effectively boosted charge separation and transfer efficiency through the synergistic interaction between RP/BP homojunctions and WO3, resulting in a high CH4 yield under visible light [216]. The study highlighted that the RP/BP@WO3 composite successfully addressed the charge transport limitations of conventional photocatalysts by employing a two-step electron transfer mechanism. By optimizing charge carrier dynamics, this photocatalyst demonstrated significantly improved photocatalytic performance, underscoring its promising potential for CO2 conversion into valuable fuels (Fig. 11c-e). However, while some progress has been made in photocatalytic CO2 reduction, the innovation is still relatively limited, and the mechanistic discussion is superficial, lacking sufficient in situ characterization and kinetic analysis.
Ou et al. presented a novel photocatalyst based on RP for the efficient reduction of CO2 [217]. By incorporating single-atom Au into the RP matrix, the researchers significantly enhanced the efficiency of C-C coupling reactions. The excellent electronic conductivity and lower electronegativity of RP enable effective adsorption and activation of CO2, facilitating the production of multi-carbon compounds. Experimental results indicate that this catalyst achieves a remarkable selectivity of up to 96% for C2H6 in CO2 reduction (Fig. 11f-h), highlighting its promising potential in sustainable energy conversion. This work offers new insights for the design of efficient photocatalysts and advances the development of CO2 conversion technologies.
In the context of the growing environmental challenges associated with the greenhouse effect, photocatalytic CO2 reduction represents a promising avenue of research due to its environmentally friendly, mild, and effective nature. Future studies should focus on elucidating the specific mechanisms of RP for CO2 reduction, with the ultimate goal of developing practical solutions for achieving carbon neutrality [111,216 -222].
6.3 Photocatalytic bacterial disinfection
The safety of drinking water is an urgent global concern, particularly in developing countries, where pathogenic microorganisms (including fungi, bacteria, viruses, spores, and protozoa) pose significant risks to water quality [223-226]. To address this pressing issue, various water disinfection techniques, such as ozonation, microbial chlorine degradation, and ultraviolet irradiation, have been employed. However, these conventional methods come with several drawbacks, including the generation of toxic by-products, high costs, and low efficiency [227-230].
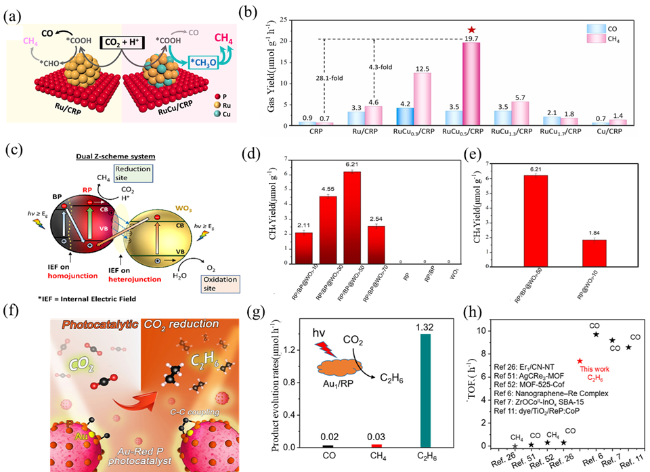
Fig. 11 (a) Proposed reaction mechanism for photocatalytic CO2 reduction reaction processes over Ru/CRP and RuCu/CRP. (b) The production yield rates of CO and CH4 in various photocatalysts under solar light irradiation. Reproduced with promission. (c) Mechanism diagram of photocatalytic reduction of CO2 by RP/BP@WO3. (d) Total photocatalytic CH4 yield achieved by RP/BP@WO3-x samples, RP, RP/BP, and WO3 after 6 h of visible light irradiation. (e) Interface-assisted catalytic C-C Coupling of Au singleatoms over RP. Photocatalytic reduction of CO2 to ethane. Reproduced with promission. (f) Photocatalytic activity of Au1/RP in CO2 reduction reaction, TOF for photocatalytic CO2 reduction of Au1/RP in comparison with recent reports. The production yield rates (g-h). Reproduced with promission. (a and b) are adapted with permission from ref. 111 (Copyright 2024, Elsevier); (c-e) are reproduced with permission from ref. 216 (Copyright 2022, American Chemical Society); and (f-h) are reproduced with permission from ref.217 (Copyright 2022, American Chemical Society). |
As a result, there is a growing need to explore innovative disinfection technologies and materials. Recently, photocatalytic water disinfection has emerged as a safe, economical, and effective alternative. In this regard, RP has gained increasing attention as an eco-friendly photocatalytic disinfection material due to its visible-light activity, reasonable cost, and broad range of applications. This is primarily due to the high stability and non-metallic nature of RP, which effectively prevents the leakage of toxic metal ions-a common issue with traditional metal-based photocatalysts [56-72,230 -232].
In this context, the use of metal-free RP can help mitigate environmental contamination caused by secondary metal ions, highlighting its critical role in environmental remediation.
Chen et al. developed a novel photocatalyst featuring RP nanodots on polymeric carbon nitride nanotubes for effective bacterial inhibition (Fig. 12a-b) [233]. The RP (40)-CN photocatalyst exhibited remarkable activity under visible light, completely inactivating Escherichia coli in 25 min and Staphylococcus aureus in 30 min, reducing bacterial concentration to 107 CFU/mL. This performance enhancement is primarily attributed to RP's role in improving the separation of photoinduced electron-hole pairs and reducing charge recombination, which enhances reactive oxygen species (ROS) generation. Additionally, RP-CN responds to longer visible light wavelengths, extending up to 700 nm. The inactivation mechanism involves bacterial membrane damage, and the photocatalyst demonstrated excellent cycling stability, achieving a 99.89% inactivation rate against S. aureus after five cycles, making it a promising solution for water treatment and environmental remediation.
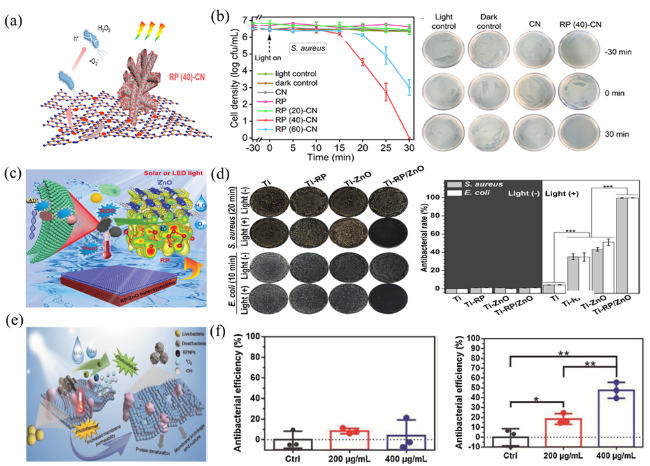
Fig. 12 (a) Mechanism of photocatalytic bacterial inactivation. (b) Photocatalytic inactivation performance and the corresponding spread plate results against S. aureus. (c) Mechanism of photocatalytic bacterial inactivation. (d) Inactivation of E.coli and corresponding spread plate results. (e) Sterilization mechanism of the RPNPs under simulated sunlight. (f)The antibacterial efficiency of RPNPs under different conditions. (a and b) are adapted with permission from ref. 233 (Copyright 2022, American Chemical Society); (c and d) are reproduced with permission from ref. 113 (Copyright 2019, Elsevier); and (e and f) are reproduced with permission from ref. 234 (Copyright 2021, Elsevier). |
Liu et al. synthesized a titanium dioxide/RP (TiO2@RP) heterostructure using a vacuum ampoule strategy to enhance its photocatalytic antibacterial properties (Fig. 12c-d) [113]. Under visible light irradiation, TiO2@RP was able to completely inactivate 7-log CFU/mL of Escherichia coli within 25 min and Staphylococcus aureus within 30 minutes. The remarkable antibacterial efficacy is attributed to the generation of strong oxidizing species, such as photogenerated holes and superoxide anions, which effectively disrupt bacterial cell membranes, leading to cell death. This research presents an innovative solution for water treatment and bacterial inactivation, highlighting the potential of TiO2@RP in environmental remediation. However, the long-term stability and durability of the TiO2@RP heterostructure have not been thoroughly assessed. Additionally, the study did not investigate the impact of varying water quality conditions on photocatalytic performance, which may limit its applicability in real-world scenarios.
RPNPs, a degradable photosensitive material, demonstrate excellent photocatalytic and photothermal properties. Under simulated sunlight, they achieve 99.98% bactericidal efficiency against Staphylococcus aureus by generating reactive oxygen species and inducing photothermal damage to bacterial membranes, making them highly effective for sterilization
(Fig. 12e-f) [234].
(Fig. 12e-f) [234].
RPNPs are biocompatible, degradable, and cost-effective. They degrade within eight weeks without toxicity to fibroblast cells. As an eco-friendly disinfectant, RPNPs show great potential, though their effectiveness depends on light conditions. Further research is needed to evaluate their long-term stability and broad-spectrum performance.
RP-based photocatalysts, as emerging sterilization materials, exhibit significant antibacterial effects and environmental advantages [235-242]. Through the photocatalytic generation of reactive oxygen species and photothermal effects, they efficiently kill bacteria, showing particular strength in disinfecting antibiotic-resistant strains. Additionally, RP-based photocatalysts have good degradability and biocompatibility, which, compared to traditional chemical disinfectants, not only reduce environmental pollution but also avoid secondary contamination. However, their performance is still influenced by light conditions, and their long-term stability and broad-spectrum antibacterial effects require further study. With continuous technological advancements, RP-based photocatalysts are expected to see wide application in environmental disinfection, air purification, and wastewater treatment, becoming an important eco-friendly sterilization material [116,242 -251].
6.4 Photocatalytic pollutant degradation
Using visible light to break down organic pollutants is an effective and environmentally friendly way to address pollution. To successfully degrade contaminants like pesticides and industrial wastewater, it’s crucial to develop photocatalysts with the right level of activity [252-257]. As photocatalytic technology advances, researchers are focusing on efficient, ecological, low-cost, and easily accessible materials to remove organic pollutants and reduce heavy metals. Among the promising materials, RP stands out as a sustainable option. It is affordable, abundant in soil, and free of metals, offering stable, efficient, and cost-effective catalysts that can degrade even challenging pollutants like organic waste [258-262].
Tao et al. synthesized Co3O4/RP photocatalysts using straightforward hydrothermal and mechanical milling techniques (Fig. 13a-b) [263]. Co3O4 nanocrystals were deposited on the RP surface, enhancing RP’s light absorption capacity compared to pure RP. The 10% Co3O4/RP composite demonstrated exceptional degradation of malachite green (MG) under visible light irradiation, achieving a 94.5% degradation rate in 20 min. In comparison, pure Co3O4 and RP showed much lower degradation rates of 17.3% and 5%, respectively. Cycling experiments revealed the catalyst’s high photocatalytic stability, with 9.9% of MG remaining degraded after multiple cycles. The Co3O4 nanocrystals effectively suppressed the recombination of photogenerated electron-hole pairs in RP semiconductors, improving its catalytic performance under visible light.
Bai et al. successfully developed a low-cost, environmentally sustainable, stable, and high-performance RP-MoS2/rGO nanocomposite through a simple two-step hydrothermal method (Fig. 13c-d) [264]. The introduction of MoS2/rGO complexes significantly improved RP’s photocatalytic properties, including the photoreduction of Cr(VI) and the photo-oxidation of various organic pollutants. These improvements were attributed to an increase in the number of excited electrons and holes, as well as enhanced charge carrier separation efficiency. The coexisting Cr(VI) and RhB exhibited superior photocatalytic activity compared to the solutions alone, demonstrating that RP-MoS2/rGO composite photocatalysts with suitable nanostructures possess excellent adsorption capacity, contributing to both the selectivity and efficiency of the catalytic process.
Zheng et al. developed an RPLDH0.8/Vis photocatalytic system based on a RP/zinc-aluminum layered double hydroxide (RP/ZnAl-LDH) heterojunction, achieving efficient antibiotic degradation (Fig. 13e) [87]. Within 90 min, the system demonstrated a tetracycline removal efficiency of 89% and a mineralization rate of 21%. Even after five cycles, the degradation performance remained above 87%. Additionally, when applied to complex water bodies like livestock wastewater, the system achieved a 15% reduction in total organic carbon (TOC) (Fig. 13f). The S-scheme heterojunction design significantly enhanced charge separation, boosting photocatalytic efficiency and minimizing the production of toxic intermediates. This innovative approach shows strong adaptability to environmental challenges and offers promising potential as a sustainable solution for wastewater treatment.
RP-based photocatalysts hold great potential for pollutant degradation. Their excellent photocatalytic properties enable the effective degradation of organic pollutants, heavy metal ions, and other environmental contaminants in water and air under light exposure. RP nanomaterials exhibit high light absorption capacity, stability, and tunability, allowing them to catalyze reactions under visible light or even sunlight, reducing energy consumption and improving degradation efficiency. Moreover, their good degradability and low cost make them an eco-friendly and economical choice. However, challenges remain in improving their catalytic efficiency, stability, and broad-spectrum performance in complex environments to enhance their practical application in pollution control.
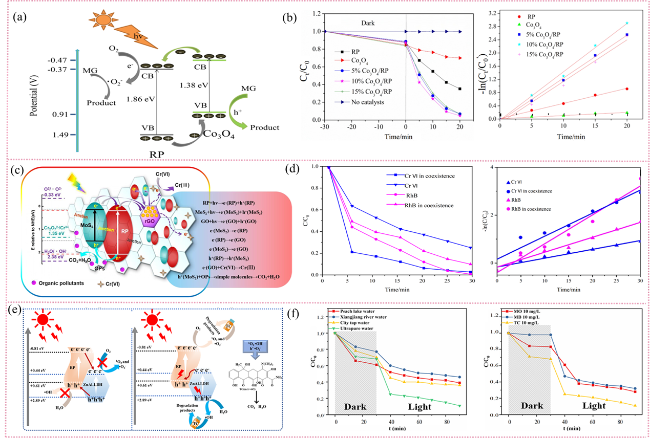
Fig. 13 (a) Photocatalytic degradation mechanism diagram. (b) Degradation efficiency and kinetics of MG under visible light using various photocatalysts. (c) Photocatalytic degradation mechanism diagram. (d) Photocatalytic performance for Cr(VI) reduction and RhB oxidation under varying conditions, with corresponding kinetic fitting. (e) Photocatalytic degradation mechanism diagram (f) Degradation efficiency in natural water samples and other organic pollutants. (a and b) are adapted with permission from ref. 263 (Copyright 2020, Elsevier); (c and d) are reproduced with permission from ref. 264 (Copyright 2018, Elsevier); and (e and f) are reproduced with permission from ref. 87 (Copyright 2023, Elsevier). |
6.5 Other photocatalytic applications
6.5.1 Nitrogen fixation
Ammonia plays a crucial role in sustaining the life cycle, serving as a vital source of nitrogen for both plants and animals. The synthesis of ammonia through nitrogen fixation is a key process in addressing the ongoing energy crisis and environmental challenges [34-45,100,265]. Traditional industrial methods, such as the Haber process, are limited by their harsh reaction conditions. In contrast, photocatalytic N2 fixation offers a promising alternative, utilizing sunlight to drive the reaction in a sustainable and environmentally friendly manner. In recent years, significant advances have been made in photocatalytic N2 conversion to NH3, presenting a potential solution for meeting the demands of modern agriculture and the fertilizer industry [266-273].
Lin’s team developed a nanocrystalline RP composite loaded on photoactive SiO2 nanorods using a simple sublimation-deposition method [100]. In this approach, RP was modified by in situ-formed carbon materials. The resulting hybrid catalyst (SiO2/C-RP) exhibited an NH2 yield of 0.73 μmol h-1 in 40 mL of pure water with a catalyst dosage of 20 mg, significantly outperforming crystalline bulk RP. This remarkable enhancement in photocatalytic activity was attributed to the synergistic effects of an increased specific surface area, improved light absorption, enhanced water dispersibility, and better charge separation properties. The findings of this study provide valuable insights for the future design of photocatalysts for nitrogen fixation.
6.5.2 Photoelectrochemical (PEC) sensing
RP-based catalysts demonstrate great potential in photoelectrochemical (PEC) sensing, particularly in enhancing interfacial charge separation and migration efficiency [274-288]. For example, a 3D CuInS2 and 2D RPns n-n heterojunction was constructed to create functional materials with superior charge transfer properties [289]. Experimental results showed that the heterojunction possesses a broad light response range and a significant built-in electric field, effectively shortening carrier transport distances and enhancing the stability of the photoinduced current. The CuInS2/RP NS-based PEC aptamer sensor exhibited a wide detection range (1.0×10⁻¹⁴ to 1.0×10⁻⁵ mg·mL-1) and an ultra-low detection limit (2.03×10⁻¹⁵ mg·mL-1) for ciprofloxacin, providing new insights into high-performance photo-sensor development and opening new avenues for environmental monitoring and biomedical applications.
6.5.3 Resource extraction and separation technology
RP-based catalysts hold significant promise in uranium extraction, especially within the tributylphosphate-kerosene (TBP-kerosene) system [280-294]. However, due to the inherent difficulty of oxidizing organic components in this system, the reduction of hexavalent uranium (U(VI)) has been challenging. To address this, a self-oxidation strategy has been proposed, where deeply oxidized RP (DO-CRP) facilitates the photocatalytic reduction of U(VI). In a 30% TBP-kerosene solution, DO-CRP achieves an impressive extraction efficiency of 88.0% and a U(VI) capacity of 580.8 mg/g within just 120 min [295]. This process leverages PO43- groups formed at defect sites in RP as binding sites to capture U(VI). During the desorption process, these defect sites are released and regenerated for the next cycle, ensuring continuous uranium extraction. Mechanistic studies indicate that this self-oxidation process enables sustained uranium extraction. This strategy not only provides a novel solution for uranium extraction in the TBP-kerosene system but also offers a breakthrough for reducing metal resources in stable organic systems.
7 Challenges in current research
(a) Synthesis methods: Current synthesis methods for RP-based catalysts are still limited by challenges in achieving high-quality, uniformly distributed materials. The development of more efficient, controllable, and cost-effective techniques is crucial to obtaining a wide range of RP nanostructures, thin films, and other tailored morphologies, while simultaneously addressing issues related to oxidation and long-term stability. Advanced approaches such as nanofabrication, high-throughput synthesis, and AI-assisted material design hold considerable promise in optimizing catalyst fabrication, enabling more precise control over structure-property relationships and enhancing the overall performance of RP-based photocatalysts.
(b) In-situ techniques: Real-time characterization of RP-based photocatalysts is essential for gaining a deeper understanding of their structural evolution and reaction mechanisms. While conventional ex-situ techniques like XRD and SEM offer valuable static snapshots, they are limited in their ability to capture dynamic transformations occurring during catalytic processes. Advanced in-situ techniques, such as Raman spectroscopy, XAS, and synchrotron-based methods, show significant promise for real-time analysis. However, their spatial and temporal resolution still requires further enhancement to fully capture transient phenomena during catalysis. Additionally, monitoring surface properties remains a considerable challenge. While XPS and IR spectroscopy provide valuable surface insights, the need for real-time, surface-sensitive techniques remains paramount to comprehensively understanding surface dynamics.
Moreover, probing the electronic states of RP-based photocatalysts during reactions is crucial for optimizing charge carrier dynamics and improving photocatalytic efficiency. Techniques like UV-visible spectroscopy and transient absorption spectroscopy offer important information on electronic transitions, but their relatively limited spatial and temporal resolution often constrains the analysis of fast processes. Emerging ultrafast techniques, such as femtosecond time-resolved spectroscopy, provide exciting opportunities to capture rapid electronic state transitions with greater precision. The integration of high-resolution, real-time monitoring techniques with computational simulations will play a pivotal role in elucidating the fundamental mechanisms that govern the photocatalytic behavior of RP-based materials, offering valuable insights for the design of more efficient photocatalysts.
(c) Theoretical calculations (Big Data and Machine Learning): Computational approaches are essential in the rational design and optimization of RP-based photocatalysts. The application of machine learning and big data analytics has greatly facilitated the discovery and fine-tuning of novel catalysts. However, the effective integration of theoretical models with experimental validation remains a significant challenge. Deep learning methodologies, such as deep-seek strategies, hold great potential for enhancing material property predictions by identifying complex patterns within high-dimensional datasets. Additionally, AI-driven generative models and reinforcement learning techniques can significantly accelerate the identification of RP-based photocatalysts with enhanced stability and activity. Cloud-based big data platforms further support collaborative research, allowing for the seamless integration of high-throughput screening with automated experimental validation processes.
The convergence of advanced machine learning models, deep-seek strategies, and big data analytics will be transformative in overcoming the current limitations of RP-based photocatalysts. The development of self-learning algorithms that continually refine their predictions through feedback from experimental results is poised to revolutionize the catalyst discovery process. Future research in this area should focus on the following priorities:
AI-Driven Material Discovery: Employing generative adversarial networks (GANs) and reinforcement learning to design innovative RP-based photocatalysts with superior performance, stability, and efficiency.
Automated High-Throughput Screening: Utilizing robotic laboratories to expedite material synthesis and characterization, thereby minimizing trial-and-error approaches and accelerating catalyst development.
Multiscale Theoretical Simulations: Integrating quantum mechanical calculations with AI-driven force fields to provide a more accurate and comprehensive representation of photocatalytic processes.
Cloud-Based Collaborative Research Networks: Establishing open data-sharing platforms to integrate experimental insights, computational predictions, and machine learning models, fostering a collaborative ecosystem that will accelerate innovation in photocatalyst development.
The integration of these approaches promises to significantly enhance the precision, efficiency, and scalability of RP-based photocatalysts, advancing both fundamental understanding and practical applications.
(d) Single-site catalysts: RP, as a promising photocatalytic material, exhibits distinctive semiconductor properties and abundant surface active sites, positioning it as a robust platform for the construction of single-atom catalysts and heteronuclear diatomic catalysts. The integration of single metal atoms enhances its optical absorption properties, charge carrier separation efficiency, and catalytic stability by modulating the local electronic structure. Meanwhile, the incorporation of heteronuclear diatomic metals exploits the synergistic interactions between two metal atoms, resulting in optimized reaction kinetics and improved catalytic selectivity. These strategies not only address the intrinsic chemical instability of RP but also significantly expand its applicability in CO2 reduction, NRR, and HER. Looking forward, achieving further breakthroughs will necessitate the precise control of the coordination environments of single-atom and diatomic metals, the rational design of metal-phosphorus interfaces to promote charge transfer, and the integration of theoretical simulations to guide the selection of metal combinations and reaction pathways. By synergizing advancements in material synthesis, in-depth characterization techniques, and application-oriented studies, RP-based photocatalysts are expected to play a transformative role in advancing sustainable energy technologies and environmental remediation efforts.
(e) Dimensional control and structural design: Dimensional control and structural design of RP-based photocatalysts enable the optimization of electronic properties and catalytic efficiency. By manipulating material dimensions (0D, 2D, and 3D), properties such as light absorption, charge separation, and transport can be enhanced. Structural strategies like heterostructure formation, defect tuning, and surface functionalization further boost performance. These approaches enable the tailored design of catalysts for specific reactions, advancing RP in sustainable energy and environmental applications.
Future research on RP-based photocatalysts can advance by optimizing synthesis methods, enhancing in situ characterization techniques, incorporating big data and machine learning in theoretical calculations, developing single-atom and bimetallic dual-atom catalysts, and exploring 0D and 2D materials, as shown in Fig. 14. By overcoming these current bottlenecks, the application effectiveness of RP-based photocatalysts in energy and environmental fields can be significantly improved.
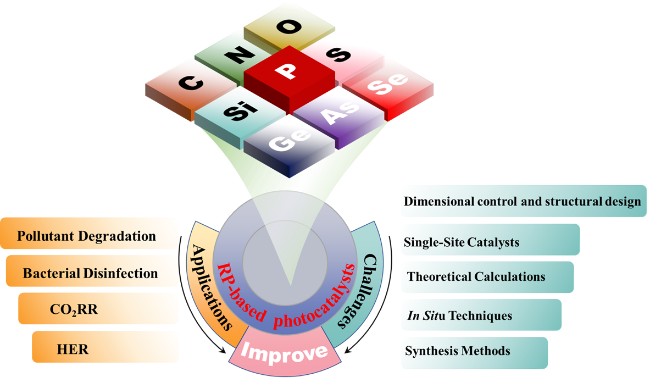
Fig. 14 Summary and perspective for RP-based photocatalysts. |
Declaration of Competing Interest
The authors declare that they have no known competing financial interests or personal relationships that could have appeared to influence the work reported in this article. Jizhou Jiang is the Editor-in-Chief, Zhiliang Jin is an Associate Editor, and Weilong Shi, Yang Qu, Enzhou Liu, Arramel are Editorial Board Members of this journal and they were not involved in the editorial review or the decision to publish this article.