


1. Introduction
In recent decades, people’s life has been significantly improved with the speedy growth of economy. Nonetheless, multitudinous pollutants—covering chemicals, pathogens, and nutrients-have been and are currently being pulled into the natural environment. Household and industrial effluents, as well as urban and agricultural runoffs, are damaging aquatic ecosystems on a scale never seen before [1]. Various technologies have been developed for the treatment of wastewater, including adsorption [2-6], biotreatment [7-10], electrochemical oxidation [11-17], photocatalysis [18-26] and piezocatalysis [27-31], etc. Of which piezocatalysis emerges as an outstanding wastewater treatment technology because its environmental friendliness, sustainability and accessibility of energy source [32-35]. Based on the integration of piezoelectric effect and electrochemical effect, piezocatalysis is a brand-new way to utilize piezo-induced charges in assisting typical chemical processes by harvesting various forms of mechanical energy [36]. As a result of the noncentrosymmetric crystal structure, a net dipole moment (macroscopically, a dielectric polarization) begins to form within piezoelectric materials as a response to external stress [37-39].The polarization separates the free charge contained in the piezocatalyst or attracts charged species outside it, which generates the redox reaction on the surface to produce oxidized active species such as hydroxyl radicals and superoxide radicals. Using substances like water and oxygen as sources. These species will finally decompose contaminant molecules into carbon dioxide and water [40,41].
The history of aquatic pollutants elimination employing piezocatalysis technology is not long, and in recent years, more and more researches have been conducted around it. Over the past decade, The concerned contaminants in the field of piezocatalysis cover organic dyes [42,43], antibiotics [44,45], bacteria [46] and other organic compounds [47-49]. Meanwhile, piezoelectric materials with different properties are also employed in the decomposition of aqueous pollutants, including zinc oxide (ZnO), perovskites, two-dimensional (2D) ultrathin materials, bismuth-based piezoelectrics, PVDF, g-C3N4, etc.[50-52] In 2012, Hong et al. applied piezocatalysis for the degradation of a dye of C.I. Acid Orange (AO7) from aqueous solution in the presence of BaTiO3 microdendrites under ultrasonic vibration [53]. In 2023, Yang et al. found that the ZnO piezoelectric mesocrystal with moderate oxygen vacancies concentration exhibits a rapid antibiotic ornidazole pollutants degradation rate (0.034 min−1) and achieves a high peroxymonosulfate (PMS) utilization efficiency (0.162) [54]. Lin et al. in 2022 reported that the few-layer 2H MoS2 nanoflowers generate a considerable quantity of hydroxyl species for degrading RhB molecules through the mechanical-force-induces piezopotential [55]. Wan et al. reported that the PVDF film embedded by BaTiO3 featuring controlled oxygen vacancies has boosted piezoelectric property and improved hydrophilicity and porosity after socking. The hydrophilic porous composite membrane adhered on impeller can effectively remove Bisphenol A under 900 rpm stirring [56]. And Tang et al. fabricated a unique g-C3N4/PDI-g-C3N4 homojunction via a facile thermal condensation method to piezo-photocatalytic degrade atrazine and the degradation rate under an optimized condition (pH=2.97) reached 94% within 60 min [57]. Among the aforementioned piezoelectric materials, ZnO is considered as an promising piezocatalyst attributed to many advantages. It exhibits biocompatibility, is frequently employed as a medicine carrier, and is environmentally benign from the standpoint of environmental effect. Economically speaking, large-scale production is feasible due to the abundance of zinc resources, low cost of raw materials, and a variety of sophisticated synthesis techniques. And its rich nanostructure can give a large number of active sites, increasing the pace of reaction in terms of catalytic activity. Additionally, it has a high piezoelectric coefficient and exhibits good piezoelectric response with regard to piezoelectricity [58,59]. Related publications and citations have significantly increased during the last two decades, as seen in Fig. 1[60-63].
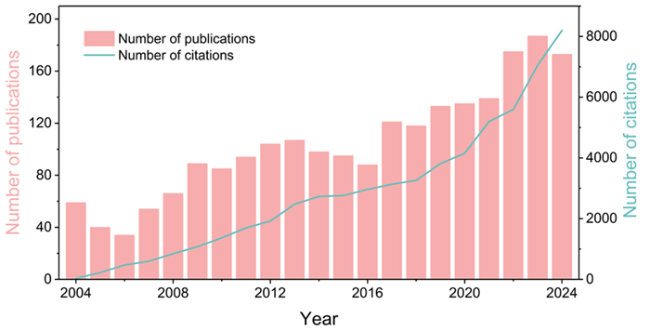
Fig. 1. Amount of publications and citations using “piezo*”, “ZnO or zinc oxide”, and “decompos* or remov* or degrad* or eliminat*” as keywords from 2004 to 2024 in Web of Science. |
The crystalline structure of hexagonal wurtzite ZnO can be described as lots of alternating planes that are composed of tetrahedrally coordinated O2- and Zn2+ ions, making an alternant arrangement tracing the c-axis [64,65]. This noncentrosymmetric nature endows ZnO with piezoelectric properties [66]. Specifically, the polarization of anions and cations induced by external strain will produce a piezoelectric potential inside ZnO [67,68]. However, ZnO still suffers from low piezoelectric catalytic efficiency [69]. At present, there are many strategies explored for enhancing the piezocatalysis performance of ZnO materials. This review categorizes these strategies as morphology controlling, composite construction, noble metal deposition, engineering vacancies, and element doping, as shown in Fig. 2. In this review, we introduce significant strategies of elevated ZnO-based piezocatalytic activity for wastewater treatment, as illustrated in Fig. 3[70-74]. Moreover, the primary challenges and probable progress orientation for constructing excellent ZnO-based piezocatalytic systems are put forward.
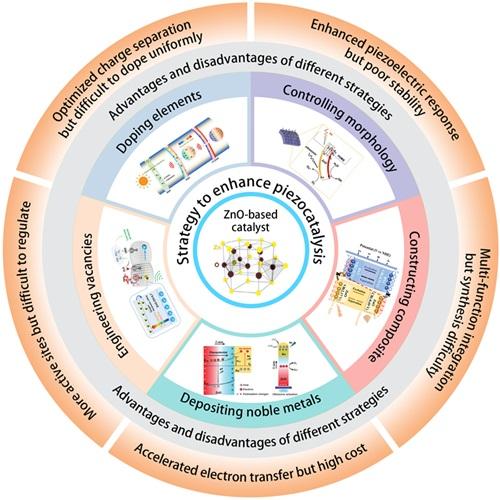
Fig. 2. Different strategies for enhancing the piezocatalytic performance of the ZnO-based catalysts. These inset figures are reproduced from ref. [75] (Copyright 2018, Materials Research Society); ref. [76] (Copyright 2019, Zhang et al.); ref. [77] (Copyright 2023, Elsevier Ltd.); ref. [78] (Copyright 2020, WILEY-VCH Verlag GmbH & Co. KGaA, Weinheim); ref. [54] (Copyright 2023, Wiley-VCH GmbH); ref. [79] (Copyright 2020, Elsevier); respectively. |
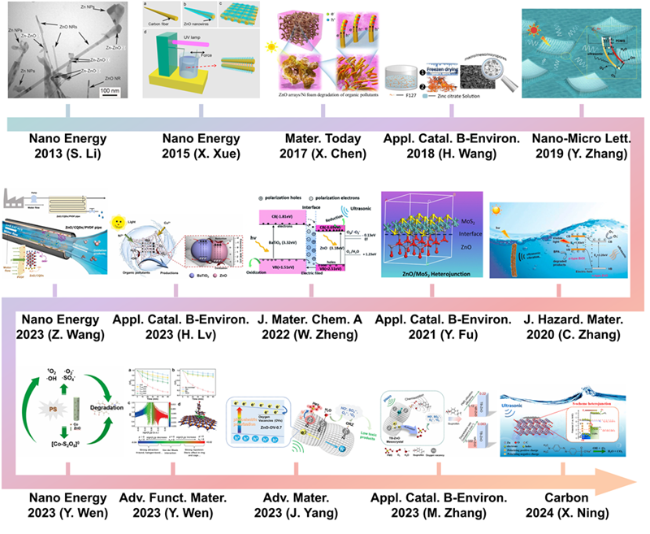
Fig. 3. Timeline for the typical strategies on enhancing piezocatalysis performance of ZnO-based catalysts for aquatic pollutants degradation. These inset figures are reproduced from ref. [80], [81] and [82] (Copyright 2013, 2015 and 2017, Elsevier Ltd.); ref. [83] (Copyright 2017, Elsevier B.V.); ref. [76] (Copyright 2019, Zhang et al.); ref. [84] and [85] (Copyright 2020, Elsevier B.V.); ref. [86] (Copyright 2022, The Royal Society of Chemistry); ref. [87] (Copyright 2023, Elsevier B.V.); ref. [88] and [89] (Copyright 2022 and 2023, Elsevier Ltd.); ref. [90] and [54] (Copyright 2023, Wiley-VCH GmbH); ref. [91] (Copyright 2023, Elsevier B.V.); ref. [92] (Copyright 2023, Elsevier Ltd.); respectively. |
2. Review necessity
ZnO, due to its interesting properties, is a widely studied semiconductor, and many reviews related to it have been published [93-96]. Some reviews focus on the synthesis methods, providing guidance for researchers to synthesize ZnO that meets their expectations [97-99]. Some reviews provide a comprehensive overview from synthesis to applications [100,101]. Despite their generality, they are quite thorough, offering a global and holistic perspective. Others concentrate on specific applications, such as biomedicine, piezoelectric devices, photocatalysis, etc., providing detailed insights and offering scholars a more microscopic and specialized viewpoint [66,102-104]. However, with the advancement of science, the potential of ZnO in piezoelectric catalytic degradation of pollutants has been highlighted, yet research in this area has not received the attention and summary it deserves. Therefore, this review summarizes the recent research progress in the field of ZnO-based piezoelectric catalysis for the degradation of aquatic pollutants, and a critical assessment of the current situation is provided along with current issues and potential future paths, which can provide helpful references and inspirations for relevant researchers. This is the significance and value of this review.
3. Synthesis of ZnO
Over the past decade, the synthesis methods of ZnO have been widely developed as research on it continues to deepen. Hydrothermal/solvothermal method is most widely used under laboratory conditions. In general, precursors are dissolved in a certain amount of solvent, which can provide a high-temperature and high-pressure environment for inorganic synthesis. The reaction system is heated and pressurized in a specially-made stainless-steel autoclave. This method possesses diverse advantages such as high specificity, simple operation, good selectivity, high accuracy, and good reproducibility[105]. Nowadays, many researchers go beyond this and add some extra steps (calcination, microwave assistance, for instance) to achieve more ideal results, such as more suitable morphology and better performance[106-108]. Zinc acetate and zinc nitrate are the most commonly used zinc sources, and the reaction generally occurs under alkaline conditions, which are adjusted using bases such as sodium hydroxide or lithium hydroxide. However, the hydrothermal/solvothermal method also has some drawbacks. The use of solvents is not environmentally friendly enough, and generally, only small-scale syntheses can be performed, which is well known to researchers. Other methods include precipitation[109-115], mechanochemical process[116-121], sol-gel method[122-124], and microwave method[99,125], which are also frequently used to synthesize zinc oxide. Each of these methods has its own characteristics and advantages. So far, many reviews have provided excellent discussions on these synthesis methods[94,100,101,126].
Finally, it must be mentioned that with the increasing awareness of environmental protection, people are paying more and more attention to the environmental friendliness of synthetic methods. The green synthesis method of zinc oxide has been widely developed in recent years, which is a concrete embodiment of meeting this requirement. Compared to other synthesis methods, it has obvious merits due to its simpler preparation process and the green and safety of the reagents used[127-129]. As its name suggests, in the green synthesis method, the stabilization and reduction of zinc precursors no longer rely on certain chemical reagents, but rather on some simply prepared biological agents. Because certain substances in organisms can also perform this function, such as proteins, amino acids, enzymes, vitamins, etc., although the specific mechanism is still unclear at present. As for the sources of these biopreparations, some come from different parts of plants such as stems, leaves, and fruits, which have been the most studied[130-134]. Others come from algae[135-139], and some come from microorganisms[140,141]. Additionally, biomass waste can also be used as raw materials, showing broad application prospects[142,143]. Currently, the main applications of zinc oxide obtained through green synthesis methods are in the fields of biology, medicine, and photocatalysis, while reports on its application in piezoelectric catalysis are rare. Consequently, if it can be widely applied in piezoelectric catalysis, that not only expands the applicability of green synthesis methods but also makes zinc oxide-based piezoelectric catalysis more green and sustainable.
4. The strategy to enhance piezocatalysis of ZnO materials
4.1 Design principles
For the modification strategies of ZnO-based piezoelectric catalytic materials, the structure-activity relationship is the key to understanding the optimization of material performance. The structural characteristics of materials (such as morphology, lattice defects, interfaces, band structure, etc.) directly determine their piezoelectric response, charge separation and transport efficiency, and catalytic activity. Optimizing these features is the fundamental principle of various modification strategies.
ZnO nanowires, nanorods, and other high aspect ratio structures are more prone to deformation under mechanical stress, generating stronger piezoelectric potentials. And porous or hierarchical structures (such as flower-like ZnO) can provide more active sites, promoting pollutant adsorption and interfacial reactions. Oxygen vacancies, acting as electron capture centers, can suppress electron-hole pair recombination at appropriate concentrations; simultaneously, they promote the adsorption of O2 to form superoxide radical. In contrast, constructing a heterojunction drives charge separation and suppresses recombination through the built-in electric field at the interface. Doping or compounding ZnO can reduce the bandgap, thereby achieving better piezoelectric and optical response. Furthermore, surface hydrophilic modification can enhance the adsorption of polar pollutants (such as dye molecules), accelerating their removal.
4.2 Enhanced piezocatalysis through controlling morphology of ZnO materials
As a representative modification approach of photocatalytic materials, morphology controlling is also used for enhancing the catalysis performance of piezoelectric materials. ZnO can take many different morphological structures such as micro/nanoparticles, nanosheets, nano-flowers, nanowires and nanorods. Its rich nanostructures stem from the diversity of synthesis methods and reaction conditions, and the different nanostructures also broaden its range of applications [144]. And it exhibits different piezoelectricity with these various forms. A. Troia et al. prepared three different ZnO nano and microparticles (Fig. 4a-c) for the degradation of Methylene Blue (MB) under ultrasonic treatment. [145]. Their research revealed that with respect to microparticles, the nanoparticles would not affected by sound attenuation, particles breakage or other energy absorbing phenomena, but increase the number of active sites for cavitating bubbles, thus making the degradation more efficient (Fig. 4d and e). Moreover, Ning et al. reported that granular and rod-like nano-ZnO were synthesized successfully through a green and harmless solid-state chemistry approach, and their piezocatalytic performance to degrade organic pollutants MB was explored by harvesting ultrasonic vibration energy [146]. The results indicated that the rod-like nano-ZnO as a novel piezocatalyst, exhibits higher piezocatalytic decomposition dye activity in compared with the granular nano-ZnO and shows good recycling utilization performance. In addition, the distribution of piezoelectric potential in granular and rod-like nano-ZnO was simulated analysis based on the finite element method with COMSOL Multiphysics approach. It is noting that the values of piezoelectric potential for rod-like nano-ZnO are much 5-18 times than that of granular nano-ZnO (Fig. 4f and g), which will facilitate easier immigration of the electrons and holes in the redox process and benefit to piezocatalytic activity and promote degradation efficiency. Analogously, Meroni et al. reported that ZnO nanorods present a much higher sonophotocatalytic activity than the other morphology (star-shaped clusters) in the disappearance of diclofenac (DCF) (Fig. 4h and i, blue line) [147]. And the same is true for DCF mineralization. Despite they are characterized by similar surface area, phase composition and optical properties. Therefore, ZnO nanorods (as well as ZnO nanowires) increasingly become a hotspot in the realm of piezoelectric catalysis employing ZnO with different morphologies.
A number of researches have shown considerable piezocatalysis/piezo-photocatalysis activity of ZnO nanorods for the degradation of organic pollutants in wastewater. Ma et al. realized the bi-harvesting of optical and vibrational energy in hydrothermally-synthesized ZnO nanorods which is designed to achieve bi-catalysis of photo-catalysis and vibration-catalysis for dye decomposition [148]. In the presence of UV irradiation only, the decomposition ratio of ZnO nanorods for acid orange 7 is ~ 56.7% within 100 min, While the value is up to ~ 80.8% adopting both UV irradiation and vibration simultaneously. The enhanced bi-catalysis of ZnO nanorods can be attributed to that the piezoelectric potential which formed in vibration-catalysis process can help separate the photogenerated electron-hole pairs, therefore achieving a synergy effect between photo-catalysis and vibration-catalysis. Cause the substrate possessing porous structure may facilitate the formation of small water turbulences inside it, which is beneficial to the deformation of piezoelectrics and enhanced piezoelectric field, leading to improved catalytic activity. Some investigators employed ZnO nanorod arrays growing on porous substrate to remove organic pollutants and got outstanding piezo-photocatalysis performance [82,149]. In view of certain challenges such as easy agglomeration, complicated recovery from liquids in the process of water decontamination using particulate or 1D nanostructure catalysts, Zhang et al. fabricated a floatable piezo‑photocatalytic platform based on semi‑embedded ZnO nanowire (NW) array [76]. In detail, a two-step synthesis route (hydrothermal growth on a rigid substrate and a second hydrothermal growth on a flexible substrate) enabled a ZnO NW array to be securely and uniformly fixed onto the polymer substrate (ZP film) (Fig. 5a-g). This platform not only addressed the aforementioned problems, but also exhibited high‑performance water decontamination. In the presence of an ultrasonic field, 15% of MB dye is decomposed by the floating ZP film in a dark condition, While the degradability of this ZP film is increased significantly when it is further assisted by UV illumination (Fig. 5i, red line), confirming the piezo-photocatalytic mechanism of the ZnO NWs. The piezo-photocatalytic mechanism and potential reactions are illustrated in Fig. 5j. As can be seen, the piezocatalysis perform two functions in the degradation process, including excitation of the electron-hole pairs and separation of the photoinduced charge carriers. Owing to the existence of an increased number of charge carriers, more reactive oxidants are converted, hence elevating the capability of degradation eventually.
Compared with ZnO nanorods, rerports on ZnO nanosheets are less which may be attributed to the fact that the sheet-like morphology is disadvantageous for harvesting vibration energy under ultrasound[150]. However, a few works showed good contaminant degradation efficiency of ZnO nanosheets during piezo-photocatalysis experiments, underlining its’ potential as efficient piezo-photocatalysts for wastewater remediation [151,152].
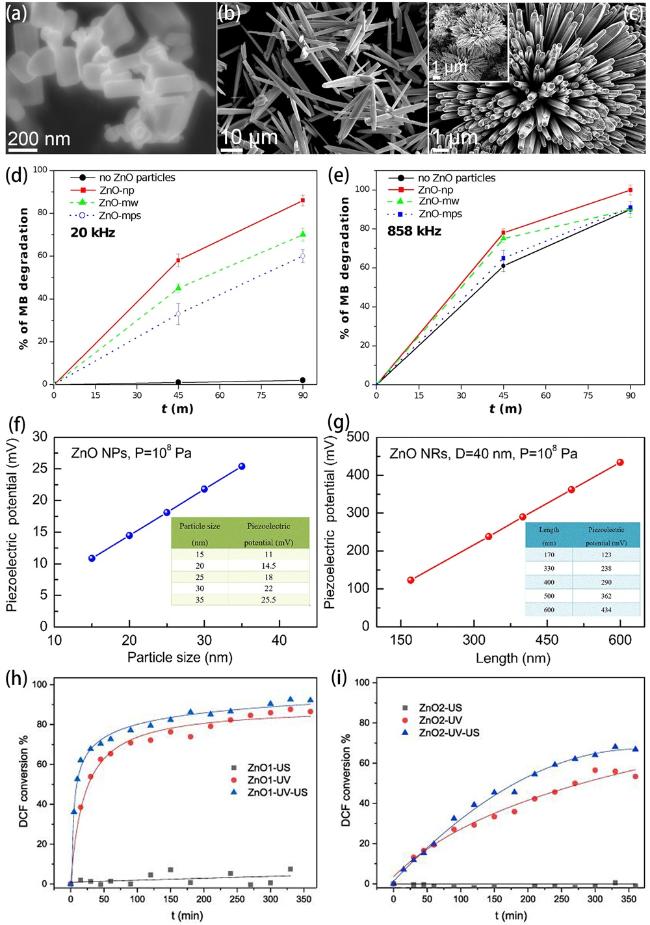
Fig. 4. (a-c) Microscopic (FESEM) images of ZnO nanoparticles (in particular nanorods), 1D microwires and multipods-like microparticles. MB degradation at 20 kHz (d) and 858 kHz (e) ultrasound in the presence of ZnO nanoparticles (ZnO-np), 1D microwires (ZnO-mw) and multipods-like microparticles (ZnO-mps) and without ZnO particles. Reproduced from ref. [145] (Copyright 2023, Troia et al.). (f) Piezoelectric potential curve versus particle size in granular nano-ZnO (ZnO NPs) under the fixed pressure of 108 Pa by COMSOL simulation. (g) Piezoelectric potential curve versus length in rod-like nano-ZnO (ZnO NRs) under the fixed diameter of 40 nm and cavitation pressure of 108 Pa by COMSOL simulation. Reproduced from ref. [146] (Copyright 2020, Elsevier Inc.). DCF conversion degree using ZnO1, i.e. ZnO nanorods (h) and ZnO2, i.e. star-shaped clusters (i) under ultrasound (US), ultraviolet light (UV) and both of them (UV-US). Reproduced from ref. [147] (Copyright 2021, Meroni et al.). |
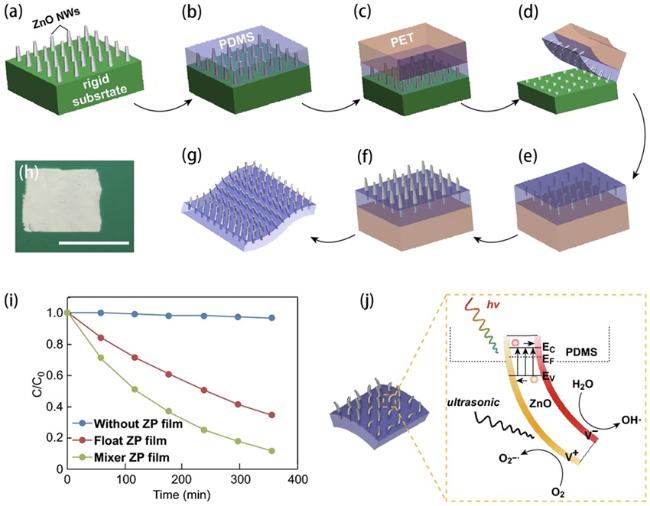
Fig. 5. (a-g) Schematic illustration of the two-step fabrication process of the vertically aligned ZnO NW array on a polymer matrix. (h) Picture of the as-prepared ZP film (1 × 1 in.2). Scale bar: 1 in. (i) Degradation curves of the MB dye in the presence of an ultrasonic field and UV light irradiation. (j) Schematic diagram of the piezo-photocatalytic mechanism. Reproduced from ref. [76] (Copyright 2019, Zhang et al.). |
4.3 Enhanced piezocatalysis through constructing composite
Constructing composite is capable of manipulating charge transportation behaviors inside catalyst due to the difference from diverse components, and this prevalent strategy has been applied to the domain of piezocatalysis over ZnO widely [153-157]. Wang et al. proposed a bi-piezoelectric ZnO nanorods (NR)/ PVDF-HFP (PVDF-HFP, a copolymer of PVDF with higher flexibilityand film-forming property than PVDF) spongy film that can utilize water flow vibration to boost the photocatalytic degradation of organic dye [158]. With mercury-xenon lamp irradiation, the efficiency increment of ZnO NR/ PVDF-HFP spongy film is greater than that of ZnO NR/melamine sponge (an inert sponge) as the stirring speed increases from 0 rpm to 1000 rpm, which implies that the PVDF-HFP spongy film can reinforce the piezoelectric field in ZnO to drive the charge transfer. In another study, Yang et al. designed an environmentally friendly ZnO/natural piezoelectric quartz composite (GZn/PQz) and applied it as an adsorbent and catalyst (photocatalyst, piezoelectric catalyst, and piezo-photocatalyst) for enhanced removal of ibuprofen (IBF) [153]. The high magnification SEM image of the GZn/PQz demonstrates the formation of green ZnO nano-nodules and longitudinal rod-like grains on the surface of the quartz (Fig. 6a), and the HRTEM images support the morphological findings of the obtained SEM images of GZn/PQz particles (Fig. 6b). In the piezoelectric oxidation of IBF molecules, GZn/PQz achieved remarkable IBF (50 mg/L) oxidation percentages of 93.8% after 360 min (Fig. 6c). It can be explained by the piezoelectric properties of both quartz and ZnO (Fig. 6d). With regard to the poor recyclability of the suspended catalysts, which can cause inevitable secondary pollution, Wu et al. synthesized a magnetically retrievable Fe3O4@SiO2@ZnO nanocomposite via layer-by-layer chemical deposition [159]. This novel nanocomposite can be quickly and easily separated for reuse by an external magnetic field. Along with the good recyclability, it also exhibited high efficiencies in piezocatalytic dye degradation processes. A comparative analysis of the catalytic performance of different ZnO-based composites for water decontamination is presented in Table 1. The above results indicate that ZnO-based composites have significant development potential in the field of piezoelectric catalysis. With the advancement of scientific research, we believe that ZnO-based composites will demonstrate broad application prospects in the future. Of course, the cumbersome preparation process and the use of environmentally unfriendly organic reagents are also issues that must be addressed.
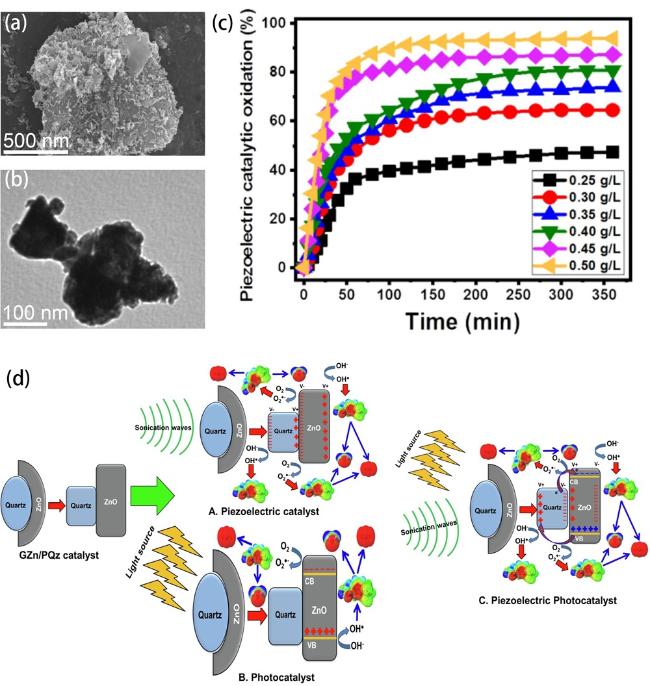
Fig. 6. (a) SEM image and (b) HRTEM image of the GZn/PQz composite. (c) The oxidation of IBF by piezoelectric catalysis with different doses of GZn/PQz catalyst. (d) General mechanism of IBF oxidation over GZn/PQz as piezoelectric catalyst, photocatalyst, and piezo-photocatalyst. Reproduced from ref. [153] (Copyright 2021, Elsevier B.V.) |
It is noteworthy that ZnO is usually integrated with diverse materials to fabricate different kinds of heterojunctions which include type II, Z-scheme, p-n type and S-scheme for enhenced piezocatalytic performance. Lv et al. developed a BaTiO3//ZnO Janus nanofibers membrane (BTO//ZO JNM) via side-by-side electrospinning which exhibited superior piezophotocatalytic performance in the removal of multi-pollutants from water [87]. As illustrated in
Fig. 7a, it’s a typical type II heterojunction. There is a partly overlapping band gap between BaTiO3 and ZnO, and the electrons in BaTiO3 will migrate and accumulate on the conduction band (CB) of ZnO, while the holes from ZnO transfer to the valence band (VB) of BaTiO3 under this circumstance. The procedure can be improved by a built-in electric field resulting from piezoelectric polarization under stir, consequently hinders the reassociation of electrons and holes obviously in BaTiO3 and ZnO and more charge carriers react with O2 and H2O to generate free radicals to enhance degradation efficiency. Zhou et al. also revealed that ZnO/BaTiO3 heterostructures have an enhanced piezophototronic effect [173]. The oxidation reaction rate constant of dyeing wastewater degradation with ZnO/BaTiO3 can be up to 1.20×10⁻¹ min-1 under concurrent ultrasound and simulated sunlight. There are else materials such as CdS [165] and (Na0.5Bi0.5)0.94Ba0.06TiO3 [174] combined with ZnO to construct type II heterojunctions for greater piezocatalysis/piezo-photocatalysis activity. Different from type II heterojunction, Fig. 7b demonstrates a Bi0.5Na0.5TiO3/ZnO (BNT/ZnO) Z-scheme heterojunction for piezo-photocatalytic water remediation [77]. The BNT/ZnO Z-scheme heterojunction reserves electrons and holes which own more powerful redox capacity due to the recombination of electrons in the CB of ZnO and holes in the VB of BNT. Fu et al. synthesized a ZnO/MoS2 heterojunction (Fig. 8a) on Ni foam [85]. As we can see in Fig. 8c-f, the ZnO/MoS2 II-type heterojunction can be converted to direct Z-scheme heterojunction by flowing-induced piezoelectric field for enhanced sunlight photocatalytic performances. Under stirring-sunlight irradiation for 50 min, the degradation efficiency of methyl orange reaches up to 92.7%, versus 50.6% under sole sunlight irradiation (Fig. 8b). Nevertheless, 50% of the charge carriers recombine at the interface theoretically in Z-scheme heterojunctions, which decreases the energy conversion efficiency [175]. In 2016, Liu et al. achieved boosted piezoelectric and piezo-phototronic performance based on p-CuI/n-ZnO heterojunction [176]. Over the past few years, many works focused on the fabrication of ZnO-based p-n heterojunction for high piezo-photocatalytic efficiency [167,177-179]. But what is p-n heterojunction? When a p-type semiconductor and a n-type semiconductor are in contact, they form a p-n junction with a space-charge region at the interfaces, and thus produce a built-in electrical potential that can move the electrons and holes in the opposite direction [180]. Zhang et al. prepared a p-n heterojunction of BiOI/ZnO (Fig. 7c) and this BiOI/ZnO nanorod arrays degraded the bisphenol solution completely within 30 min under concurrent visible-light irradiation and ultrasonic vibration [84]. Such prominent catalytic activity can be ascribed to the synergy of the piezoelectric field created by ZnO nanorod and the built-in electrical potential in the p-n heterojunction. Recently, S-scheme heterojunctions garnered interest in the domain of ZnO-based piezo-photocatalyst because of its strong redox potential, which can be attributed to the internal electric field, band bending, and Coulombic attraction [181]. As shown in Fig. 9a, Lv et al. constructed a S-scheme heterojunction of ZnO/Cs2AgBiBr6 nanorod array (ZC NRA) via a seed-assisted hydrothermal method followed with a multi-step spin-coating process [163]. Under simulated sunlight irradiation with magnetic stirring, the RhB is almost degraded absolutely by the fabricated catalysts in 12 min and the degradation kinetic constant is 0.391 (Fig. 9b and c). The dramatical degradation performance of the ZC NRA can be ascribed to the coupling mechanism of the S-scheme heterojunction and the piezoelectric field, which contributes to the efficient separation of charge carriers (Fig. 9d iv).
Fig. 7a, it’s a typical type II heterojunction. There is a partly overlapping band gap between BaTiO3 and ZnO, and the electrons in BaTiO3 will migrate and accumulate on the conduction band (CB) of ZnO, while the holes from ZnO transfer to the valence band (VB) of BaTiO3 under this circumstance. The procedure can be improved by a built-in electric field resulting from piezoelectric polarization under stir, consequently hinders the reassociation of electrons and holes obviously in BaTiO3 and ZnO and more charge carriers react with O2 and H2O to generate free radicals to enhance degradation efficiency. Zhou et al. also revealed that ZnO/BaTiO3 heterostructures have an enhanced piezophototronic effect [173]. The oxidation reaction rate constant of dyeing wastewater degradation with ZnO/BaTiO3 can be up to 1.20×10⁻¹ min-1 under concurrent ultrasound and simulated sunlight. There are else materials such as CdS [165] and (Na0.5Bi0.5)0.94Ba0.06TiO3 [174] combined with ZnO to construct type II heterojunctions for greater piezocatalysis/piezo-photocatalysis activity. Different from type II heterojunction, Fig. 7b demonstrates a Bi0.5Na0.5TiO3/ZnO (BNT/ZnO) Z-scheme heterojunction for piezo-photocatalytic water remediation [77]. The BNT/ZnO Z-scheme heterojunction reserves electrons and holes which own more powerful redox capacity due to the recombination of electrons in the CB of ZnO and holes in the VB of BNT. Fu et al. synthesized a ZnO/MoS2 heterojunction (Fig. 8a) on Ni foam [85]. As we can see in Fig. 8c-f, the ZnO/MoS2 II-type heterojunction can be converted to direct Z-scheme heterojunction by flowing-induced piezoelectric field for enhanced sunlight photocatalytic performances. Under stirring-sunlight irradiation for 50 min, the degradation efficiency of methyl orange reaches up to 92.7%, versus 50.6% under sole sunlight irradiation (Fig. 8b). Nevertheless, 50% of the charge carriers recombine at the interface theoretically in Z-scheme heterojunctions, which decreases the energy conversion efficiency [175]. In 2016, Liu et al. achieved boosted piezoelectric and piezo-phototronic performance based on p-CuI/n-ZnO heterojunction [176]. Over the past few years, many works focused on the fabrication of ZnO-based p-n heterojunction for high piezo-photocatalytic efficiency [167,177-179]. But what is p-n heterojunction? When a p-type semiconductor and a n-type semiconductor are in contact, they form a p-n junction with a space-charge region at the interfaces, and thus produce a built-in electrical potential that can move the electrons and holes in the opposite direction [180]. Zhang et al. prepared a p-n heterojunction of BiOI/ZnO (Fig. 7c) and this BiOI/ZnO nanorod arrays degraded the bisphenol solution completely within 30 min under concurrent visible-light irradiation and ultrasonic vibration [84]. Such prominent catalytic activity can be ascribed to the synergy of the piezoelectric field created by ZnO nanorod and the built-in electrical potential in the p-n heterojunction. Recently, S-scheme heterojunctions garnered interest in the domain of ZnO-based piezo-photocatalyst because of its strong redox potential, which can be attributed to the internal electric field, band bending, and Coulombic attraction [181]. As shown in Fig. 9a, Lv et al. constructed a S-scheme heterojunction of ZnO/Cs2AgBiBr6 nanorod array (ZC NRA) via a seed-assisted hydrothermal method followed with a multi-step spin-coating process [163]. Under simulated sunlight irradiation with magnetic stirring, the RhB is almost degraded absolutely by the fabricated catalysts in 12 min and the degradation kinetic constant is 0.391 (Fig. 9b and c). The dramatical degradation performance of the ZC NRA can be ascribed to the coupling mechanism of the S-scheme heterojunction and the piezoelectric field, which contributes to the efficient separation of charge carriers (Fig. 9d iv).
Table 1. Catalytic performance of different ZnO-based composites toward pollutant degradation. |
| Materials | Model pollutants | Degradation efficiency | External conditions | Pros and cons | Ref. |
|---|---|---|---|---|---|
| ZnO/piezoelectric quartz core-shell | IBF (50 mg L-1) | 100% for 40 min | Ultrasound (20 kHz) + metal halide lamp (400 W) | Green synthesis/ many steps | [153] |
| MoOx/ZnS/ZnO ternary complex | RhB (10 mg L-1) | ~ 99% for 90 min | Ultrasound (40 kHz, 120 W) | Good performance/ environmentally unfriendly | [154] |
| ZnO NR/PVDF-HFP spongy film | MO (5 mg L-1) | 95% for 75 min | Stirring (1000 rpm) + mercury-xenon lamp irradiation. | Easy to recycle/ environmentally unfriendly, many steps | [158] |
| Ultrathin ZnO/Al2O3 | MO (50 mg L-1) | 100% for 15 min | Ultrasound (~40 kHz, 100 W) | Excellent performance/ environmentally unfriendly, many steps | [160] |
| ZnO@ZIF-8 core-shell | TC (50 mg L-1) | 91.5% for 40 min | Ultrasound (35 kHz, 180 W) | Good performance/ poor stability | [161] |
| ZnO@PVDF film | RhB (12 mg L-1) | ~ 97% for 100 min | Stirring + Xe lamp (300 W) | Bi-piezoelectric effect, more (100) polar plane exposure / environmentally unfriendly | [162] |
| BaTiO3/ZnO continuous nanofiber | RhB (5 mg L-1) | 98.94% for 90 min | Ultrasound (120 W) + Hg lamp (300 W) | Bi-piezoelectric effect/ environmentally unfriendly, many steps | [86] |
| ZnO/MoS2 nanoarray | MO (10 mg L-1) | 92.7% for 50 min | Stirring + Xe lamp (300 W) | Flowing-induced piezoelectric field/poor stability, many steps | [85] |
| BaTiO3//ZnO Janus nanofibers membrane | TC | 97.65% for 60 min | Stirring (800 rpm) + Xe lamp (300 W) | Simultaneously removal of multi-pollutants/ environmentally unfriendly, many steps | [87] |
| BiOI/ZnO nanorod arrays | BPA (10 mg L-1) | 100% for 30 min | Ultrasound (40 kHz, 90 W) + Xe lamp (300 W) | Expanded light absorption range, excellent performance/ poor stability, many steps | [84] |
| ZnO/Cs2AgBiBr6 nanorod arrays | RhB (10 mg L-1) | ~ 100% for 12 min | Stirring (500 rpm) + Xe lamp (300 W, equipped with AM 1.5G filter) | Excellent performance /environmentally unfriendly, many steps | [163] |
| GQDs/ZnO | MO | 96.1% for 60 min | Ultrasound (40 kHz, 150 W) | Excellent carrier separation/ many steps | [92] |
| Bi2WO6/g-C3N4/ZnO | RhB (5 mg L-1) | 95.1% for 20 min | Ultrasound (40 kHz, 80 W) | Expanded the charge transfer path/ environmentally unfriendly, many steps | [164] |
| CdS/ZnO | RhB (10 mg L-1) | 98.8% for 90 min | Ultrasound (40 kHz, 120 W) | Improved charge separation/ toxicity | [165] |
| ZnO/g-C3N4 nanoarrays | MB (10 mg L-1) | 93.70% for 120 min | Stirring (1000 rpm) + Xe lamp (300 W) | Flowing-induced piezoelectric field /many steps | [166] |
| CuS/ZnO nanowires | MB (5 mg L-1) | ~ 100% for 20 min | Ultrasound (200 W) + Xe lamp (500 W) | Excellent performance, easy to recycle/ many steps | [167] |
| ZnO/ZnS nanotube | MB (10 mg L-1) | 63.3% for 50 min | Ultrasound (120 W) + Hg-lamp (500 W) | Suppressed carriers recombination /low degradation rate constant | [168] |
| KNbO3/ZnO nanocomposite | MO (10 mg L-1) | ~ 100% for 90 min | Ultrasound (40 kHz, 120 W) + Xe lamp (300 W) | Improved charge separation/ many steps | [169] |
| g-C3N4[U]/ZnO | RhB (10 mg L-1) | 99% for 120 min | Ultrasound (40 kHz, 60 W) + visible light (50 W) | RhB degradation and H2 production/ many steps | [170] |
| ZnO/CuS | TC (30 mg L-1) | 85.28% for 60 min | Ultrasound (120 W) + Xe lamp (300 W, λ > 400 nm) | Narrow bandgap/ environmentally unfriendly, many steps | [171] |
| ZnO/SnS | Cr(VI) (20 mg L-1) | 98% for 35 min | Ultrasound | Cr(VI) removal/ environmentally unfriendly, many steps | [172] |
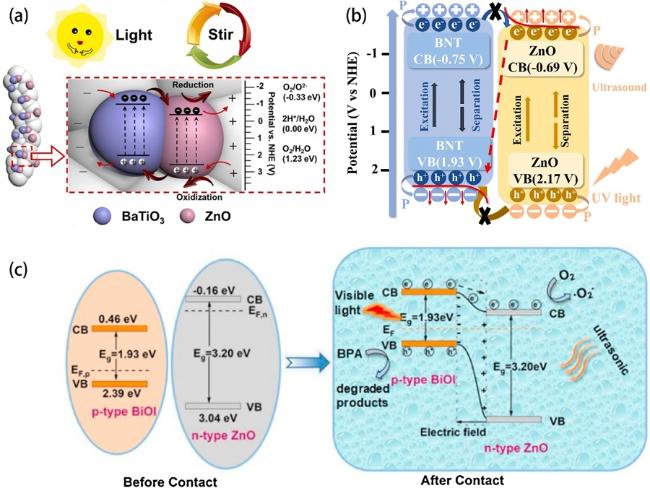
Fig. 7. (a) Piezo-photocatalytic mechanism of 2% BTO//ZO JNM under stir + light irradiation. Reproduced from ref. [87] (Copyright 2023, Elsevier B.V.). (b) mechanism schematic of RhB degradation through piezo-photocatalysis of BNT-1%ZnO. Reproduced from ref. [77] (Copyright 2023, Elsevier Ltd.). (c) Formation of p-n heterojunction between BiOI and ZnO, and probable separation process of charge carriers in the BiOI/ZnO nanorods under light and ultrasonic vibration. Reproduced from ref. [84] (Copyright 2020, Elsevier B.V.). |
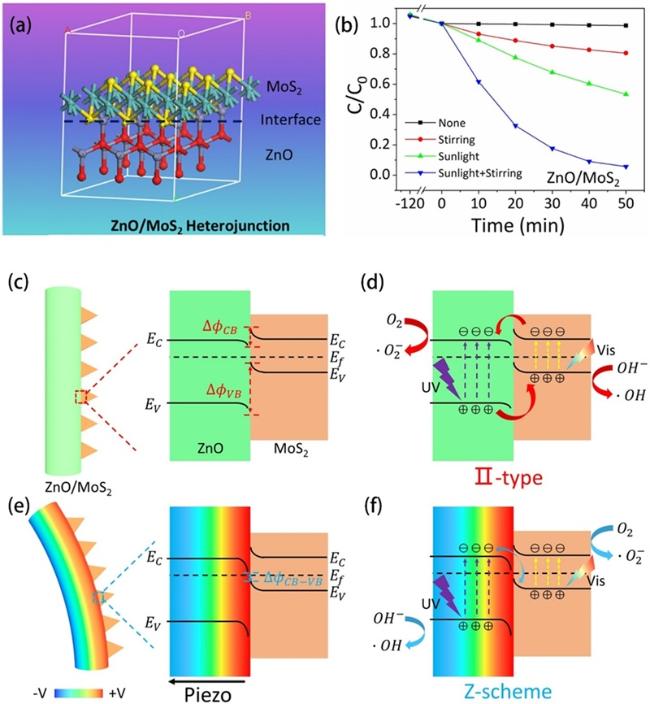
Fig. 8. (a) Schematic illustration of lattice structure of ZnO/MoS2 heterojunction. (b) MO degradation efficiencies under different conditions. Energy band diagrams of ZnO/MoS2 without stirring (c) and under stirring (e). The migration of photogenerated charge carries and production of reactive oxygen species under sole sunlight irradiation (d) and stirring-sunlight irradiation (f). Reproduced from ref. [85] (Copyright 2020, Elsevier B.V.). |
What's more, many researchers integrated ZnO with carbon-based materials to achieve remarkable piezocatalytic or piezo-photocatalytic performance [80,83,182]. Carbon-based materials not only cost lower, but also can promote the transfer rate of charge carriers [88]. Wen et al. successfully constructed a C-layer coated ZnO (C-ZnO) as shown in Fig. 10a by a simple hydrothermal method [90]. The lattice spacing of 0.26 nm displayed in the high-resolution TEM image of C-ZnO (Fig. 10b) corresponds to the (002) lattice plane of hexagonal ZnO, indicating that the crystal properties of ZnO is intact after the C-layer modification. And the elemental mapping images demonstrate that the C layer is homogeneously distributed on the axial surface of ZnO (Fig. 10c). In the finite element analysis, the surface of C-ZnO produced a higher piezoelectric potential (22.6 V) than that of ZnO (Fig. 10d), implying the superior piezoelectric output of C-ZnO. Resulting from the good charge transfer that leads to more reactive species production in the solution, the degradation efficiency of C0.02-ZnO is close to 90% employing BPA as a model contaminant (Fig. 10e). Graphene oxide (GO) [46] and metal-organic framework (MOF)-derived porous carbon materials[183] were also employed to combine with ZnO to increase the piezocatalytic or piezo-photocatalytic degradation efficiency of organic dyes pollutants. And the ZnO-GO exhibited excellent antibacterial activity against E. coli under the ultrasonic waves. It is worth mentioning that Wang et al. prepared a biochar-based piezocatalyst using a method involving the in situ growth of ZnO on a Yang flocculant to improve the activity of the piezocatalyst [184]. And the aquatic toxicity migration was evaluated during the tetracycline (TC) degradation process. This strategy can simultaneously reuse biomass waste and deal with TC wastewater. Moreover, the same group proposed a novel ZnO/CQDs/PVDF pipe system which achieved a removal rate of 95.17 % of TC within 70 min excited by hydrodynamic force and exhibited extremely low energy consumption [88]. The excellent piezoelectric property can be ascribed to the presence of CQDs which improve the electron transport efficiency and the β-phase-rich PVDF which is more sensitive to low-frequency pressure responses (Fig. 10f). Meanwhile, the ZnO/CQDs/PVDF pipe can inhibit the biotoxicity effect of intermediates generated during the TC degradation process.
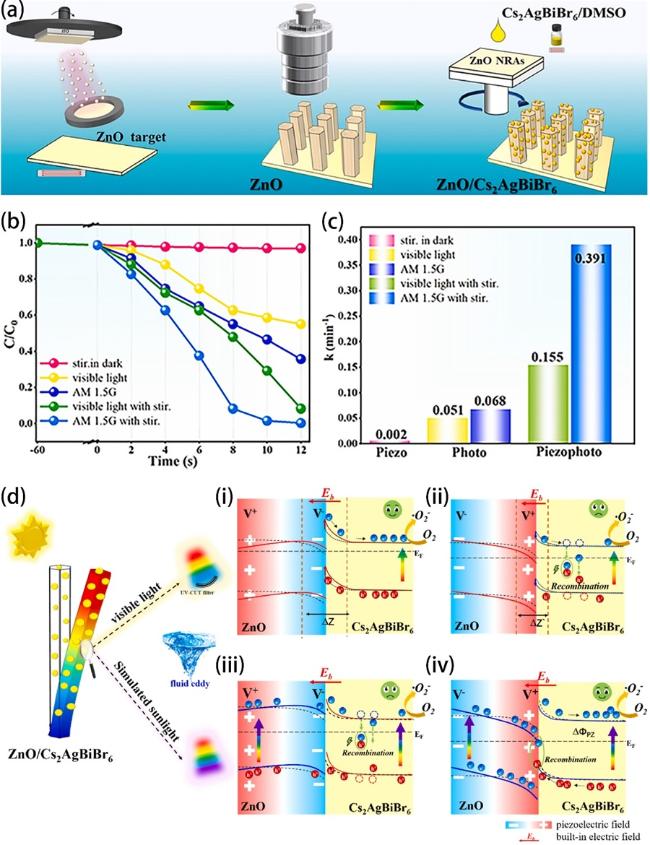
Fig. 9. (a) Illustration of the synthesis process of the ZnO/Cs2AgBiBr6 nanorod array. (b) Degradation efficiencies of RhB using ZC0.5 under different situations (visible light, simulated sunlight, visible light with stirring, simulated sunlight with stirring) and (c) corresponding calculated k values. (d) Proposed mechanism of piezoelectric field and photosource-modulated photocatalysis of ZnO/Cs2AgBiBr6 S-scheme heterojunction, (i, ii) ZnO under visible light irradiation (λ > 420 nm) and (iii, iv) ZnO under simulated sunlight irradiation in ZnO/Cs2AgBiBr6 S-scheme heterojunction under opposite piezoelectric field directions. Reproduced from ref. [163] (Copyright 2023, Elsevier Ltd.). |
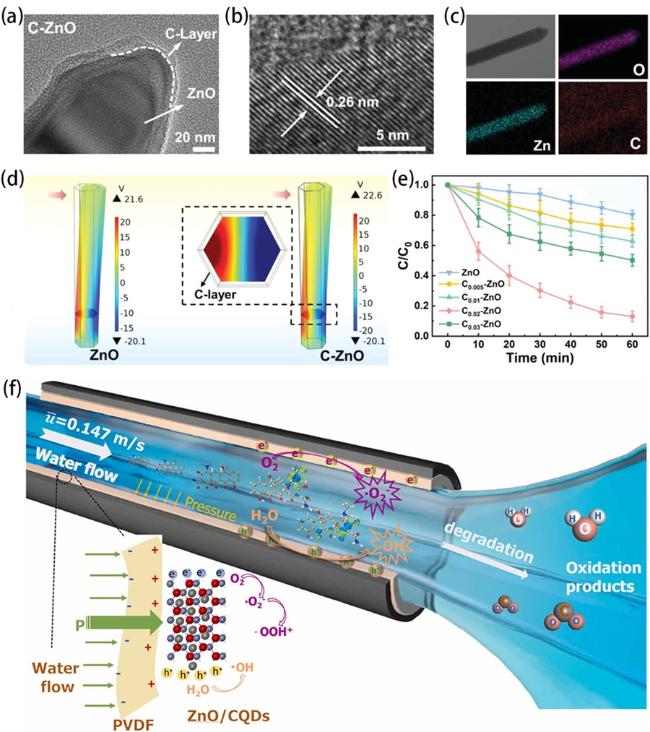
Fig. 10. (a, b) TEM images of C-ZnO nanorods. (c) Element mapping images of C-ZnO nanorods. (d) The results of piezoelectric potential distribution in ZnO and C-ZnO simulated by the finite element method. (e) The degradation of BPA over C-ZnO. Reproduced from ref. [90] (Copyright 2023, Wiley-VCH GmbH). (f) Mechanism of TC degradation with ZnO/CQDs/PVDF pipe piezoelectric catalytic system. Reproduced from ref. [88] (Copyright 2022, Elsevier Ltd.). |
4.4 Enhanced piezocatalysis through depositing noble metals on the surface of ZnO materials
Despite the high cost, it has been covered that depositing noble metals (such as Au, Pt, and Ag) on piezoelectric ZnO surface can promote the performance of catalysis [78,185-188]. The formation of Schottky junction at the interface of precious metal and ZnO with Fermi level alignment can promot the decoupling of charge carriers [185]. In the meanwhile, noble metal loading works as a useful strategy to reinforce the absorption of light in piezo-photocatalysis via surface plasmon resonance (SPR) effect, thus improving catalytic property [186]. So far, the fashionable ways to load noble metal on ZnO include photoreduction reaction and hydrothermal method. Ning et al. discovered the benefit of Ag decoration on ZnO nanocrystals for piezocatalysis via a facile hydrothermal method, in which the moderate addition of Ag significantly increased the piezocatalytic degradation activity [189]. In another study, Xiang et al. elaborately deposited Au nanoparticles only at the tip of the ZnO nanorods (asymmetric Au-ZnO denoted as Asy-Au-ZnO) by a photoreduction method
(Fig. 11a) to optimize piezo-photoelectric catalysis [78]. As illustrated in Fig. 11b and c, The Asy-Au-ZnO achieved a 95% decomposition of RhB in 75 min under all-spectrum light irradiation and ultrasonic actuation, higher than that of ZnO (77%) and symmetric Au-ZnO (88%). The greatly enhanced catalytic performance of the Asy-Au-ZnO was attributed to the unique 1D asymmetric architecture, which not only integrated the piezotronic effect of ZnO and plasmonic effect of Au nanoparticles, but also realized the spatially directed separation and migration of carriers (Fig. 11d). Zhang et al. further pushed the investigation about noble metal more deeply to dual noble metals [185]. With the help of Au nanoparticles and Pt nanoparticles, excellent carriers separation effect inspired the Au/ZnO/Pt system to boost the surface catalytic reaction for highly efficient dye degradation (Fig. 12d and e). In addition, coating noble metal on ZnO NRs which grow around piezoelectric PVDF substrate also realized outstanding piezo-photocatalytic activity [186].
(Fig. 11a) to optimize piezo-photoelectric catalysis [78]. As illustrated in Fig. 11b and c, The Asy-Au-ZnO achieved a 95% decomposition of RhB in 75 min under all-spectrum light irradiation and ultrasonic actuation, higher than that of ZnO (77%) and symmetric Au-ZnO (88%). The greatly enhanced catalytic performance of the Asy-Au-ZnO was attributed to the unique 1D asymmetric architecture, which not only integrated the piezotronic effect of ZnO and plasmonic effect of Au nanoparticles, but also realized the spatially directed separation and migration of carriers (Fig. 11d). Zhang et al. further pushed the investigation about noble metal more deeply to dual noble metals [185]. With the help of Au nanoparticles and Pt nanoparticles, excellent carriers separation effect inspired the Au/ZnO/Pt system to boost the surface catalytic reaction for highly efficient dye degradation (Fig. 12d and e). In addition, coating noble metal on ZnO NRs which grow around piezoelectric PVDF substrate also realized outstanding piezo-photocatalytic activity [186].
4.5 Enhanced piezocatalysis through engineering vacancies
Vacancy engineering (mainly oxygen vacancies) can also significantly affect the piezoelectric catalytic performance of ZnO, but its impact is contradictory. In terms of oxygen vacancies, on one hand, they can act as electron capture centers to promote the separation of charge carriers and provide more active sites, thereby enhancing the efficiency of catalytic reactions. On the other hand, excessive oxygen vacancies may become recombination centers, accelerating the recombination of charge carriers and negatively impacting the catalytic performance [190-192]. Thus, it is essential to carefully regulate the oxygen vacancy concentration.
Interestingly, a twin-brush ZnO piezoelectric mesocrystal (TB-ZnO) with abundant oxygen vacancies was constructed by Zhang et al. to optimize piezo-polarization charge migration and provide rich active sites [91]. And the effects of oxygen vacancies in TB-ZnO for the piezo-activation of PMS toward organic pollutant ibuprofen (IBP) removal were investigated. The SEM images in Fig. 13a and b show that TB-ZnO with a symmetric twin-brush-like structure consists of numerous ZnO nanorods aligned in parallel, revealing the orientated attachment of nanocrystallites in TB-ZnO. Notably, in the experiment of IBP degradation, when ZnO/piezo systems were combined with PMS, significant improvement in IBP removal was observed for TB-ZnO (~100% IBP removal) relative to NR-ZnO (84.2%), revealing the great activity of TB-ZnO toward piezocatalytic PMS activation (Fig. 13c). The reaction mechanism for IBP degradation using TB-ZnO/piezo/PMS process is proposed in Fig. 13d. The introduction of oxygen vacancies enabled ZnO to change internal structure for a stronger non-overlapping of positive and negative ion centers, which contributed to building the electric-field with greater polarization intensity. More polarized charges in the electric-field could bring about more free carriers to boost catalytic redox reactions. Meanwhile, the presence of oxygen vacancies can promote the specific adsorption of reactants (PMS, H2O) and enable more electrons to participate in the reactions, thereafter, promoting PMS utilization and H2O activation for improved IBP degradation.
4.6 Enhanced piezocatalysis through doping elements into ZnO materials
Many studies have shown that element doping functions as a feasible technique to optimize piezoelectric property and related piezocatalytic activity [193,194]. Yuan et al. successfully fabricated Cl doped ZnO NRs (Cl-ZnO) through a solvothermal method, and realized the tuning of piezoelectric properties [79]. As we can see in Fig. 14a and b, The crystallographic structure of the Cl-ZnO was confirmed by X-ray diffraction (XRD). Results of piezoeletric property experiments indicate that the Cl-ZnO possesses a more distinct radial piezoelectric properties relative to pristine ZnO (Fig. 14c and d), which can be attributed to the radial lattice expansion induced by Cl doping. Eventually, the piezo-photocatalysis coupling constant of the optimal 5%-Cl-ZnO is 24.4 times greater than that of pure ZnO for the degradation of organic pollutants. The enhanced performance benefits from the synergy of the higher piezoelectric field in the radial direction and the electronic highway in the axial direction (Fig. 14e). Compared with nonmetal, it is more prevalent taking metal as the dopant [195,196]. Wang et al. prepared a LaxFe0.1−x codoped ZnO nanorod arrays and the concentration ratio of 1:1 of Fe and La endows the codoped ZnO arrays with optimal ferroelectric properties [197]. Wen et al. successfully prepared Co-doped ZnO NRs and achieved considerable levofloxacin (LVX) degradation efficiency (Fig. 15a) by combining the piezoelectric effect with the persulfate (PS) activation process [89]. The Co sites anchored on ZnO NRs can promote the charge separation which was verified by the tests of piezoelectric current response (Fig. 15b), thereby facilitating the piezocatalytic process. The enhanced piezoelectric property is due to the structural distortion of ZnO after Co doping, and doped Co also serves as an efficient activation site for PS (Fig. 15c). The practical application prospects of the constructed novel catalytic system were further confirmed by the satisfactory degradation efficiency based on hydraulic potential energy. Meng et al. moved forward by loading Zn0.8Co0.2O onto PVDF, and realized 92.72 % removal rate within 60 min in the piezocatalytic degradation of chlortetracycline (CTC) [198]. What’s more, the changes of morphology and zinc/oxygen vacancies induced by element doping also make a difference to the piezocatalytic performance of ZnO [196].
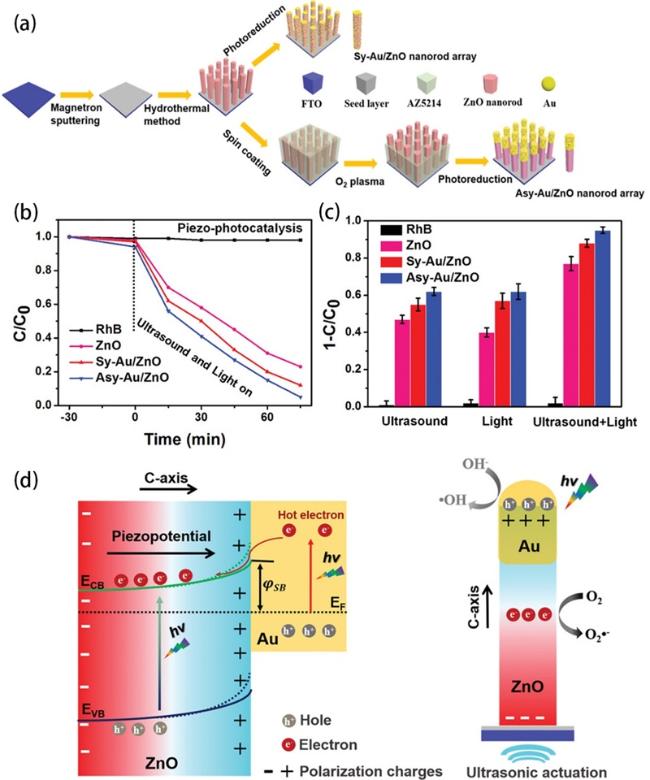
Fig. 11. (a) Schematic of the fabrication process of the asymmetric Au-ZnO and the symmetric Au-ZnO nanorod array. (b) Piezo-photocatalytic degradation of RhB with different catalysts, and control sample without catalysts. (c) Summarized histogram of the RhB degradation under different conditions for 75 min. (d) Mechanism of the enhanced catalytic activity induced by piezotronic effect and unique asymmetric nanostructure under light illumination and ultrasound stimulation (, Schottky Barrier; and, the conduction band energy and valence band energy of ZnO, respectively;, energy of the Fermi level). Reproduced from ref. [78] (Copyright 2020, WILEY-VCH Verlag GmbH & Co. KGaA, Weinheim). |
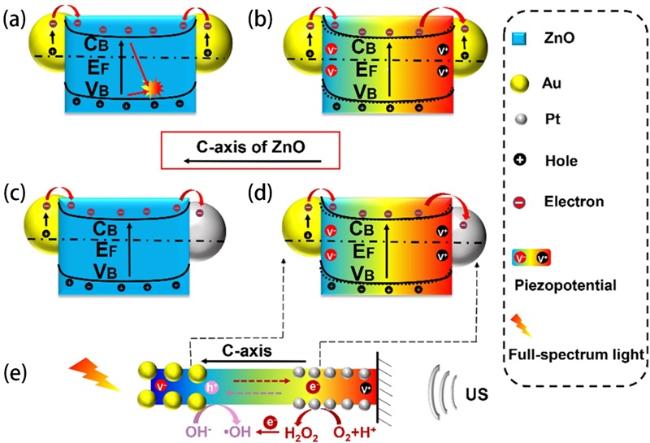
Fig. 12. Mechanism of the enhanced catalytic performance via piezo-phototronic effect and the unique structure under ultrasonic wave and light irradiation (CB and VB, the conduction band and valence band of ZnO, respectively; EF, energy of the Fermi level). (a) AZA under light irradiation. (b) AZA under concurrent ultrasonic wave and light irradiation. (c) AZP under light irradiation. (d) and (e) AZP under concurrent ultrasonic wave and light irradiation. AZA, Au/ZnO/Au; AZP, Au/ZnO/Pt. Reproduced from ref. [185] (Copyright 2022, Elsevier Ltd.). |
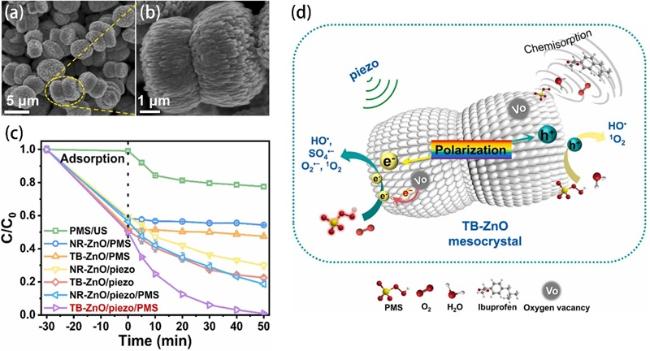
Fig. 13. (a, b) SEM images of TB-ZnO. (c) Degradation efficiencies of IBP in different catalytic systems. (d) IBP degradation mechanism with the TB-ZnO/piezo/PMS system. Reproduced from ref. [91] (Copyright 2023, Elsevier B.V.). |
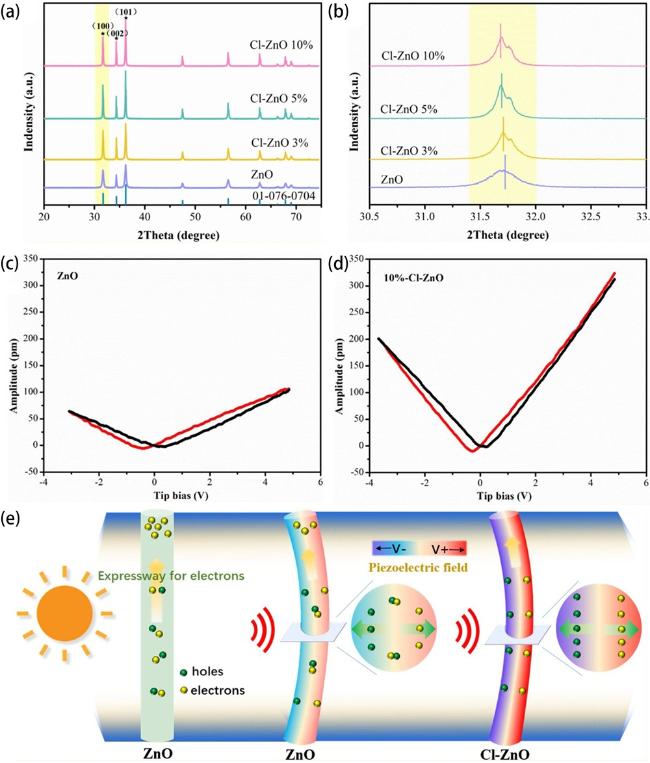
Fig. 14. (a) XRD patterns of undoped ZnO, 3%-Cl-ZnO, 5%-Cl-ZnO, 10%-Cl-ZnO and (b) an magnifying view of the ZnO (100) peak. The amplitude butterfly loop for (c) ZnO and (d) 10%-Cl-ZnO coated onto an indium tin oxide under ±10 V DC bias field along radial direction. (e) Schematic diagram for the catalytic mechanism of the ZnO and Cl-ZnO under different external conditions. Reproduced from ref. [79] (Copyright 2020, Elsevier). |
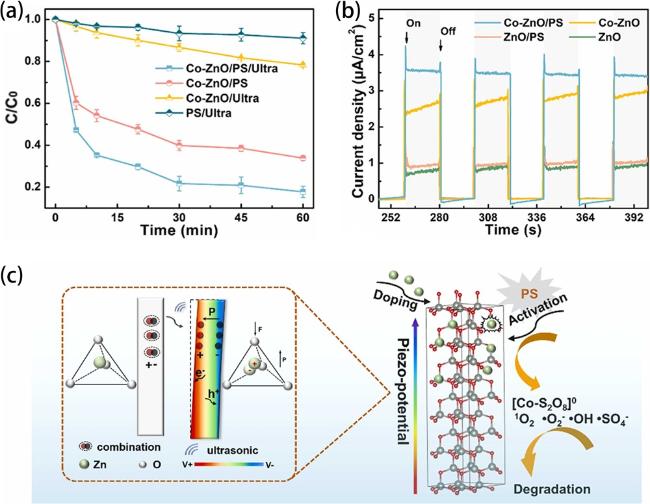
Fig. 15. (a) degradation curves of LVX under different conditions. (b) Transient piezoelectric current properties of ZnO and Co-ZnO with different systems. (c) Schematic diagram of piezo-promoted PS activation. Reproduced from ref. [89] (Copyright 2023, Elsevier Ltd.). |
4.7 Promising and advanced modification strategies
In addition to the aforementioned modification strategies, there are many other appealing strategies waiting for researchers to explore in order to enhance ZnO-based piezocatalytic performance. Amorphous single-atom catalysts have attracted increasing interest from researchers due to their high atomic utilization and unique electronic structure [199-201]. And diatomic catalysts take this a step further, theoretically capable of forming synergistic active sites, enhancing specific reaction pathways, and further boosting catalytic activity. Unlike traditional heterojunctions, van der Waals heterojunction breaks through the limitation of lattice matching by vertically stacking different two-dimensional materials through weak van der Waals force, with no covalent bonds between the layers. Due to the minimal defects at the interface, this heterojunction exhibits excellent charge separation and transport properties, greatly facilitating catalytic reactions [202-204]. What's more, spin state regulation alters the occupancy state of electron spins through external stimuli or material design, achieving precise control over the electronic structure of catalysts, intermediate adsorption energy, and reaction kinetics [205-207]. It has significant applications in fields such as energy conversion and catalysis.
5. Mechanism analysis
5.1 Theoretical calculations
Theoretical calculations are highly significant in order to verify the excellent performance and piezoelectric catalytic potential of ZnO-based materials [208-210]. It can reveal the mechanisms related to catalytic activity at the atomic and electronic levels, and provide theoretical backing for experimental research [211]. Through first-principles calculations, some strategies such as doping and passivation have been proven to enhance the piezoelectric properties of ZnO, involving elastic softening and increased surface polarization [212,213]. Zhao et al. performed density functional theory (DFT) calculations on the reaction free energies and important intermediate transition states of each step in the oxidation process of formaldehyde on the ZnO (100) surface [214]. As shown in Fig. 16a and b, in the piezoelectric catalytic system, externally induced piezoelectric polarization can significantly reduce the free energy barrier, altering the rate-determining step of the oxidation of formaldehyde, thereby making the entire reaction easier to proceed. Unlike the former, Ran et al. employed DFT simulations to better understand the interactions between O2 molecules and cobalt-loaded ZnO (CZO) with varying concentrations of oxygen defects (CZO, CZO-OV1, CZO-OV2, CZO-OV3) at the molecular leve [215]. The results indicate that the more defect sites exposed on the catalyst surface, the more electrons will transfer from the oxygen vacancies to the Co clusters, leading to electron enrichment in the Co clusters, thereby promoting the adsorption and activation of O2 molecules (Fig. 16c). Additionally, in order to delve deeper into the reaction center, Wen et al. calculated the adsorption energies of O2 and H2O molecules on the Au-ZnO Schottky heterojunction material through DFT calculations [216]. The findings suggest that H2O tends to be oxidized at the ZnO sites, whereas O2 tends to be reduced at the Au sites
(Fig. 16d and e). The avoidance of competition at reaction sites can improve the reaction efficiency of hydrogen peroxide production through dual channels.
(Fig. 16d and e). The avoidance of competition at reaction sites can improve the reaction efficiency of hydrogen peroxide production through dual channels.
Furthermore, The calculated band structure, total density of states (TDS), partial density of states (PDS), and spatial distribution of e- cloud, play an important role in demonstrating the enhanced electron-hole separation in ZnO-based materials [217-219]. Currently, theoretical calculations are mainly used for supporting and interpreting experimental results. In the future, they will develop towards prediction to reduce trial-and-error costs, guiding the synthesis of ZnO-based materials to achieve high performance.
5.2 In situ characterization
Traditional ex-situ characterization may lead to information distortion due to changes in external conditions. In contrast, in-situ characterization techniques can directly observe under different conditions such as aqueous phase, illumination, and mechanical vibration. This can avoid the impact of samples being removed from their real environment, overcoming the limitations of traditional ex-situ characterization. Therefore, in-situ characterization is crucial for revealing reaction mechanisms, dynamic processes, and active sites [220-225]. In situ diffuse reflectance infrared Fourier transform spectroscopy (DRIFTS) indicates that, unlike the treatment with H2/methanol (MeOH)/H2O, the Cu/ZnO catalysts treated with H2/ethanol (EtOH)/H2O and H2/1-propanol (PrOH)/H2O exhibit stable physical adsorption of EtOH and PrOH under argon (Ar) purging and N2O chemisorption (Fig. 17a-c). This suggests that physically adsorbed EtOH and PrOH will occupy the surface active sites, thereby negatively affecting the catalyst's capacity to catalyze methanol steam reforming [226]. Via in situ X-ray absorption near-edge structure (XANES) and extended X-ray absorption fine structure (EXAFS) under CO2 hydrogenation reaction conditions, Liu et al. observed that as the reaction temperature increased, the atomically dispersed ZnO species gradually gathered to form ZnO aggregates (Fig. 17d and e). In the first derivatives of the XANES spectra (Fig. 17f), the changes of the peaks may indicate the presence of a considerable number of oxygen vacancies in ZnO under the reaction conditions, which is crucial for catalytic activity [227]. Moreover, the use of multiple in situ characterizations makes the reaction process clearer. Through in situ DRIFTS and in situ electron paramagnetic resonance (EPR), Jiang et al. conducted in-depth studies on the photocatalytic conversion of methane on ZnO−AuPd2.7% (Subscript 2.7% represents the molar percentage of Pd to Au) from molecular and electronic levels, and identified main intermediates and key activation sites in this process (Fig. 17g and h) [228].
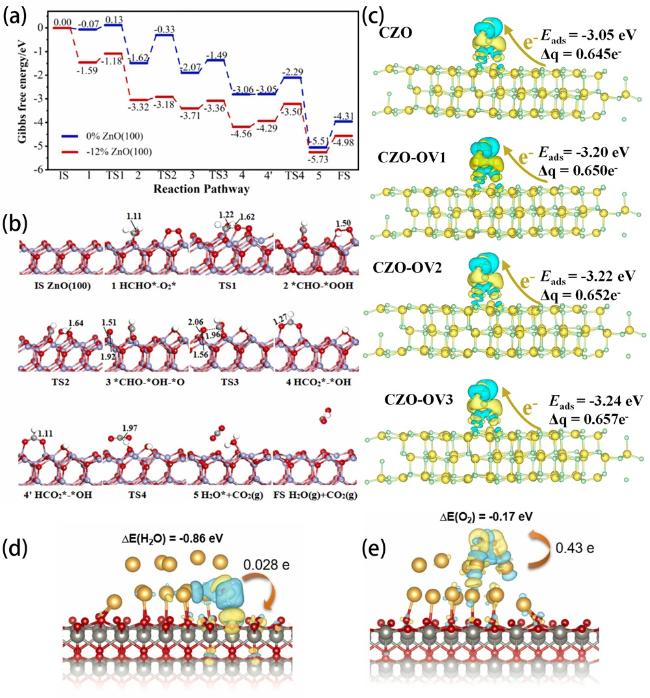
Fig. 16. (a) Profiles of free energy for catalytic oxidation of formaldehyde onto ZnO (100) surfaces. (b) The computed transitional states and intermediate state structures for catalytic oxidation of formaldehyde onto -12% ZnO (100) surface. Reproduced from ref. [214] (Copyright 2024, Elsevier B.V.). Where -12% indicates the degree of compressive strain. (c) The charge density difference of the O2 molecule on cobalt-loaded ZnO with varying oxygen vacancy concentrations (the isosurface is adjusted to 0.0005 eV; the blue electronic cloud indicates electron gain and the yellow electronic cloud indicates electron loss). Reproduced from ref. [215] (Copyright 2024, Ran et al.). (d) H2O adsorption energy on ZnO sites of Au-ZnO model. (e) O2 adsorption energy on Au sites of Au-ZnO model. Reproduced from ref. [216] (Copyright 2024, Elsevier Ltd.). |
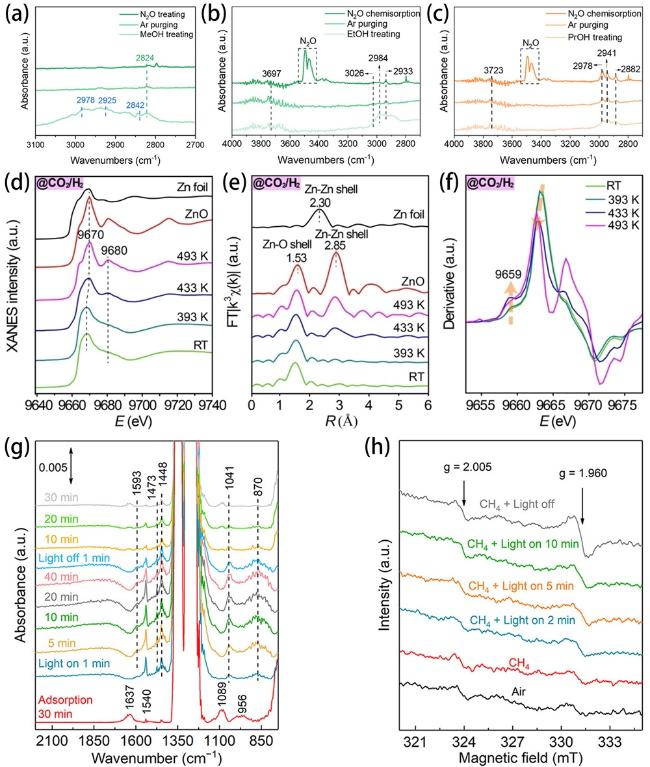
Fig. 17. In situ DRIFTS of Cu/ZnO in (a) H2/MeOH/H2O, Ar, and N2O atmospheres, (b) H2/EtOH/H2O, Ar, and N2O atmospheres, (c) H2/PrOH/H2O, Ar, and N2O atmospheres. Reproduced from ref. [226] (Copyright 2023, Wiley-VCH GmbH). (d) Normalized XANES spectra and (e) Fourier transforms of EXAFS spectra of 1ZnO/Cu(OH)2 (“1” denotes the number of ZnO atomic layer deposition cycles) during CO2 hydrogenation under a pressure of 0.8 MPa at different temperatures. (f)First derivative of the Zn K edge spectra of the 1ZnO/Cu(OH)2 inverse catalyst during CO2 hydrogenation at different temperatures. Reproduced from ref. [227] (Copyright 2022, Wiley-VCH GmbH). (g) In situ DRIFTS spectra for photocatalytic conversion of CH4 over ZnO-AuPd2.7%. (h) In situ EPR signals of ZnO-AuPd2.7% collected under different environments. Reproduced from ref. [228] (Copyright 2020, American Chemical Society). |
What needs to be pointed out is that there are currently few reports on the in-situ characterization of ZnO-based materials in the field of piezocatalytic degradation of aquatic pollutants. The application of in-situ characterization is expected to reveal the intrinsic relationship between the piezoelectric effect and catalytic activity, and provide a reference for optimizing material design and reaction conditions. At the same time, combining in-situ characterization with theoretical calculations to elucidate the catalytic mechanism from both experimental and theoretical perspectives will make the mechanism clearer and more convincing.
6. Summary and perspective
In the last several years, efficient contaminant elimination on the ground of piezocatalysis using ZnO-based materials has denoted a prospective pathway to alleviate water pollution. It is of great value to sum up and evaluate the multifarious strategies used to improve the piezocatalytic performance based on ZnO, which furnishes valuable reference on the construction of excellent ZnO-based piezocatalytic systems to accord with the requirement of practical application. In this review, the research advancement of strategies on enhancing ZnO-based piezocatalytic performance of wastewater purification were summarized. Which can obviously surmount some intrinsic drawbacks of pristine ZnO and optimize piezocatalytic behaviors.
Whereas, with semblable strategies, different works sometimes emphasized on distinct factors which contribute to the melioration of ZnO-based piezocatalytic efficiency. It is of great reasonableness and acceptance to take into account the influence of manifold factors comprehensively and determine which is the key. And this is based on the deepening understanding of piezocatalytic physicochemical process of ZnO that needs more cohesive collaboration of researchers coming from different territories. And there still exist a number of crucial issues and more efforts are required to put into (Fig. 18) [229-233]. Some issues are as follows:
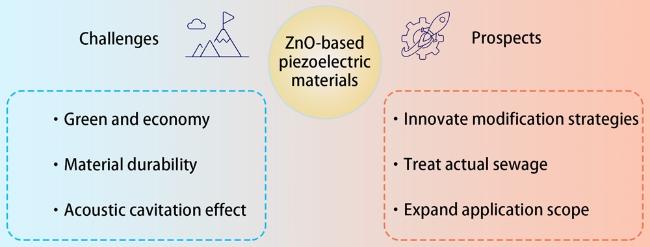
Fig. 18. Challenges and prospects of ZnO-based piezoelectric materials. |
(1) Currently, in the research concerning the piezoelectric catalytic degradation of water pollutants using ZnO-based materials, the synthesis of materials often employs hydrothermal/solvothermal methods, which are evidently not environmentally friendly. Therefore, greener synthesis methods, such as using plant extracts, are needed. Meanwhile, It is necessary to conduct an economic analysis of the materials. Evaluating the cost of raw materials, purposefully using alternative, lower-cost reagents, utilizing waste products if possible, and optimizing the synthesis process of the materials will provide greater economic advantages for the resulting materials. Moreover, the durability of the obtained materials is certainly not excellent, which will hinder their practical application. Most studies report cycle times of 3 to 5, and a noticeable performance decline can be observed, with reasons including material structural damage, active site passivation, surface contamination, etc. Consequently, it is necessary to enhance the durability of the materials through methods such as surface engineering and regeneration treatment.
(2) In view of the fact that piezocatalysis for wastewater remediation using ZnO-based meterials is an emerging research field, it is fairly significative to enrich the content of each existing strategy and further, explore novel strategies for the promotion of piezocatalytic capability.
(3) At present, there is hardly report on actual sewage treatment employing the piezocatalysis of ZnO-based materials mainly due to the complicated physicochemical property and contaminants’ coexistence of actual wastewater. In addition, some troubles such as high energy consumption, potential high toxicity of pollutant intermediates and inferior retrievability of catalysts still remain. It is of necessity to overcome all these challenges in the future for the practical application of ZnO-based piezocatalysts.
(4) During the piezocatalysis course, importance should be attached to the acoustic cavitation triggered by high-intensity ultrasonic irradiation. Because of the rupture of water, oxygen and other molecules in cavitation bubbles, the acoustic cavitation will produce free radicals which can participate in the reaction of pollutant degradation. This is not a part of piezocatalysis and corresponding experiments should be conducted to confirm the contribution of acoustic catalysis.
(5) Recently, ZnO-based piezocatalytic materials are mainly applied in water purification and H2 generation. There are still potential application territories such as H2O2 production, CO2 reduction and nitrogen fixation which are eager to be explored. And the exploration will eventually widen the application range of ZnO-based piezocatalysts. Furthermore, different catalytic systems such as photocatalysis, electrocatalysis, thermocatalysis, and piezoelectric catalysis have similarities in the catalytic process, but as their names suggest, their significant difference lies in the energy source that initiates the catalytic process. Different energy sources have different limitations. In order to meet the application needs of various scenarios and achieve effective, low-energy, and broad-ranging environmental governance and energy conversion, multi-mechanism synergistic catalytic systems (such as piezoelectric-optical-thermal coupling) that incorporate the advantages of various technologies have a bright future.
Declaration of competing interest
The authors declare no conflict of interest.