×
Title
Text
Close
Close
Submit
Cancel
Confirm
×
Title
×
Search
Editor center
Submit
Toggle navigation
Home
About Journal
Journal Information
Editorial Board
Awards
Journal Metrics
Contact
Journal Online
Just Accepted
Current Issue
Highlights
Archive
Most Read
Most Download
Most Cited
Guide for Authors
Publishing ethics
Publishing ethics
Generative AI policy
Subscribe
Figure/Table detail
Selective oxygen vacancy engineering for shrinking the potential barrier of S-scheme heterojunction toward highly efficient photocatalytic CO
2
conversion
Yue Huang, Jinfeng Zhang, Olim Ruzimuradov, Shavkat Mamatkulov, Kai Dai, Jingxiang Low
Composite Functional Materials
, 2025, 1(
1
): 20250103. DOI:
10.63823/20250103
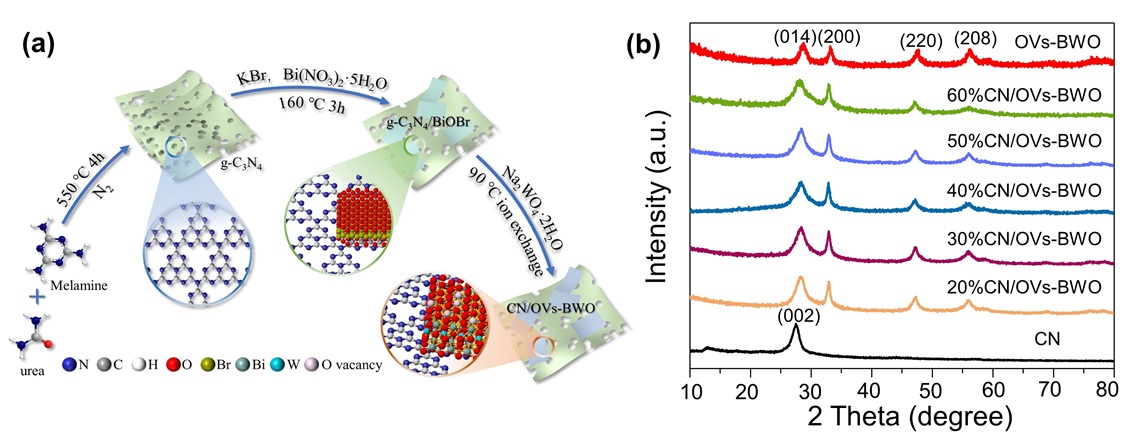
Figure 1.
(a) Schematic illustration for the preparation procedure of the CN/OVs-BWO. (b) XRD patterns of the prepared samples.
Other figure/table from this article
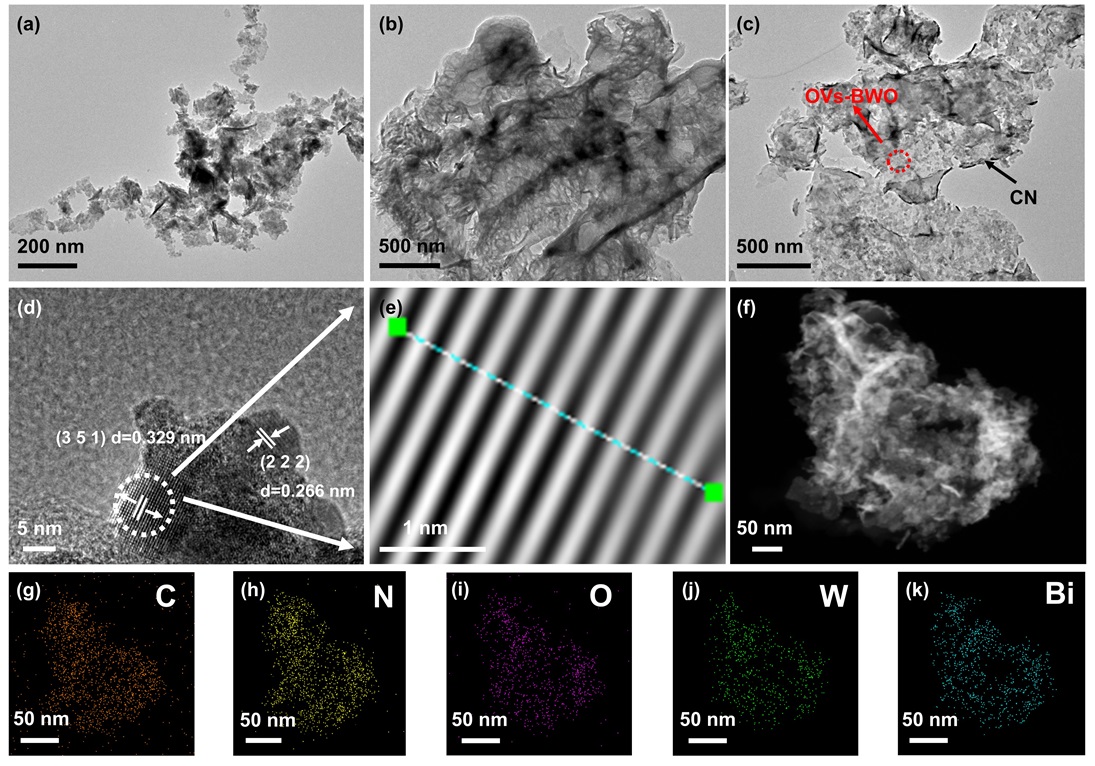
Figure 2.
(a-c) TEM images of OVs-BWO (a), CN (b), 40%CN/OVs-BWO (c). (d-k) HRTEM image (d), lattice spacing (e), SEM image (f) and elemental mapping images (g-k) of 40%CN/OVs-BWO.
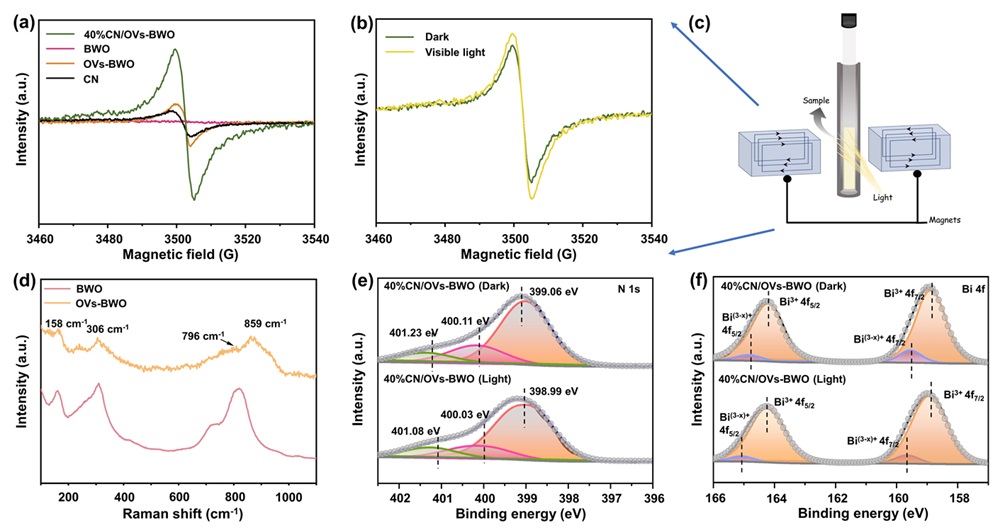
Figure 3.
(a) Electron paramagnetic resonance (EPR) spectra of CN, OVs-BWO, BWO and 40%CN/OVs-BWO. (b) In situ EPR spectra of 40%CN/OVs-BWO under dark and visible light irradiation conditions. (c) Schematic illustration for the configuration of in situ EPR system. (d) Raman spectra of samples of OVs-BWO and BWO. (e, f) ISI-XPS curves of N 1s (e) and Bi 4f (f).
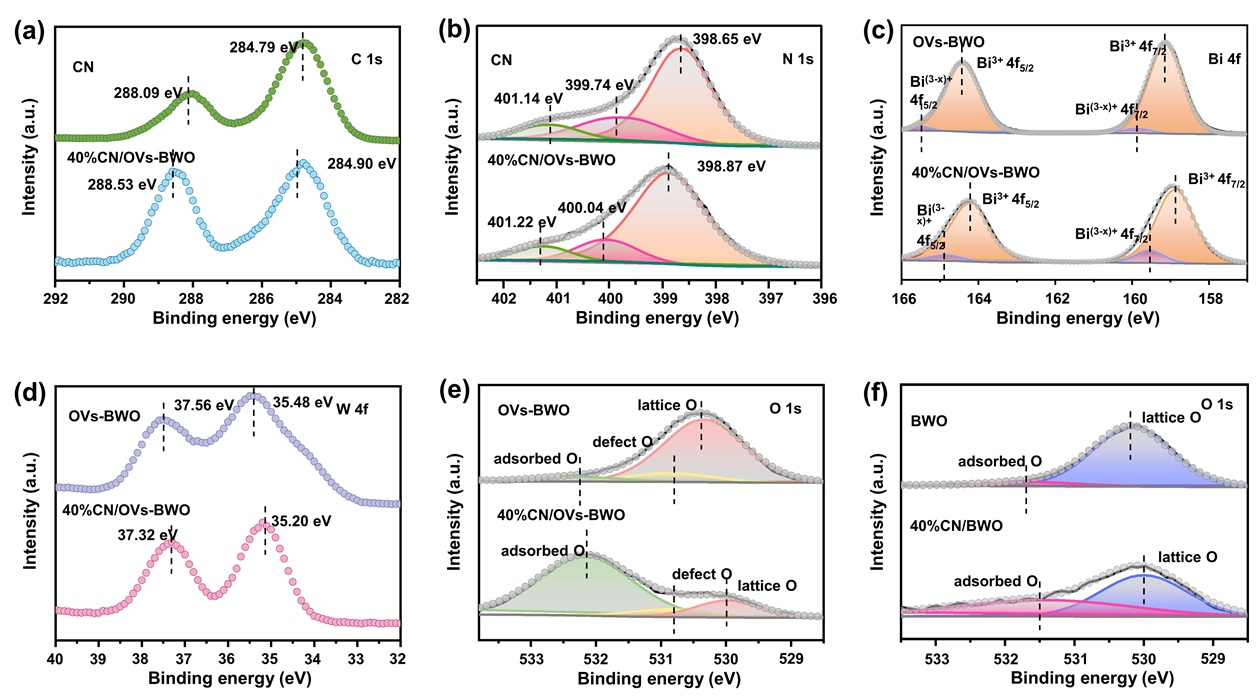
Figure 4.
(a-e) High-resolution (a) C 1s, (b) N 1s, (c) Bi 4f, (d) W 4f and (e) O 1s XPS spectra of CN, OVs-BWO and 40%CN/OVs-BWO. (f) High-resolution O 1s XPS spectra of BWO and 40%CN/BWO.
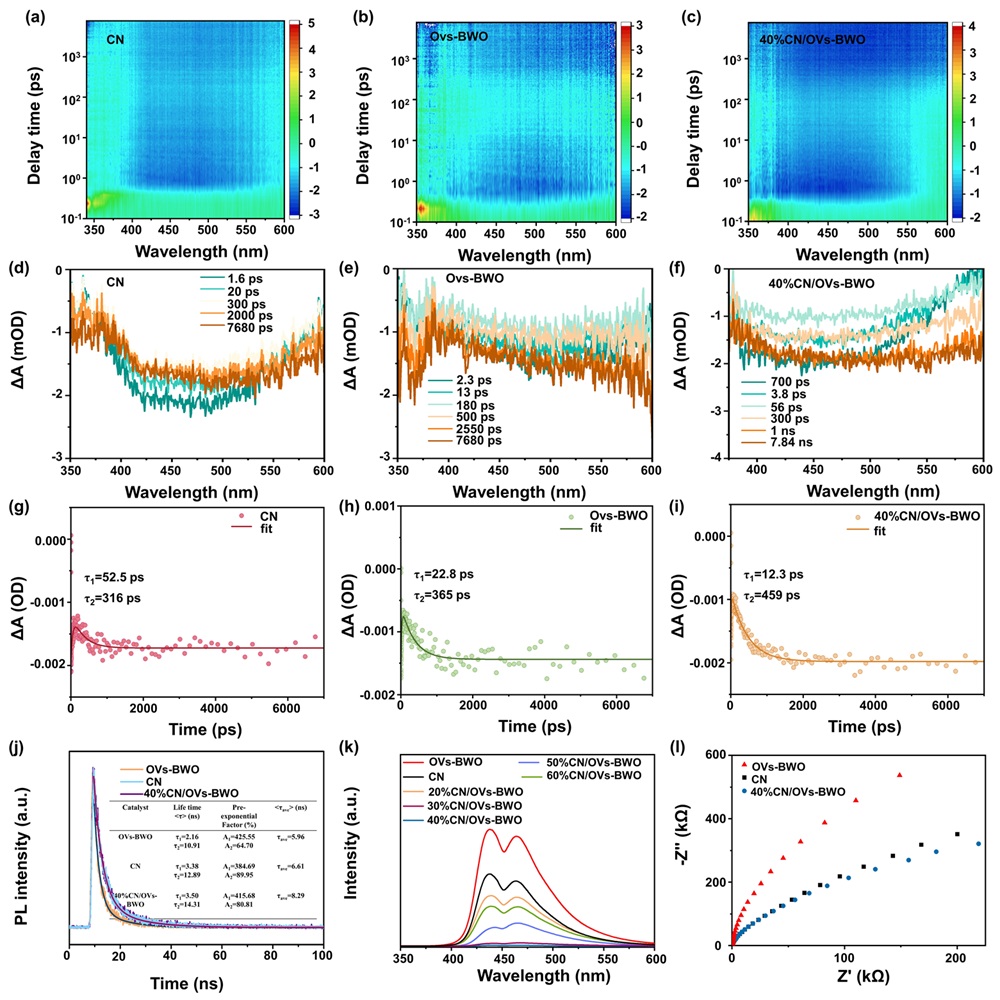
Figure 5.
The pseudocolor plots of (a) CN, (b) Ovs-BWO and (c) 40%CN/OVs-BWO. Transient absorption spectra (d) CN, (e) Ovs-BWO and (f) 40%CN/OVs-BWO.The corresponding fs-TAS decay curves (at 500 nm) for (g) CN, (h) Ovs-BWO and (i) 40%CN/OVs-BWO photocatalysts. (j) Time-resolved PL spectra of theindividual photocatalysts. (k) PL spectra of CN, OVs-BWO and CN/OVs-BWO loaded with different CN contents. (l) EIS Nyquist plots of CN, OVs-BWO and 40%CN/OVs-BWO.
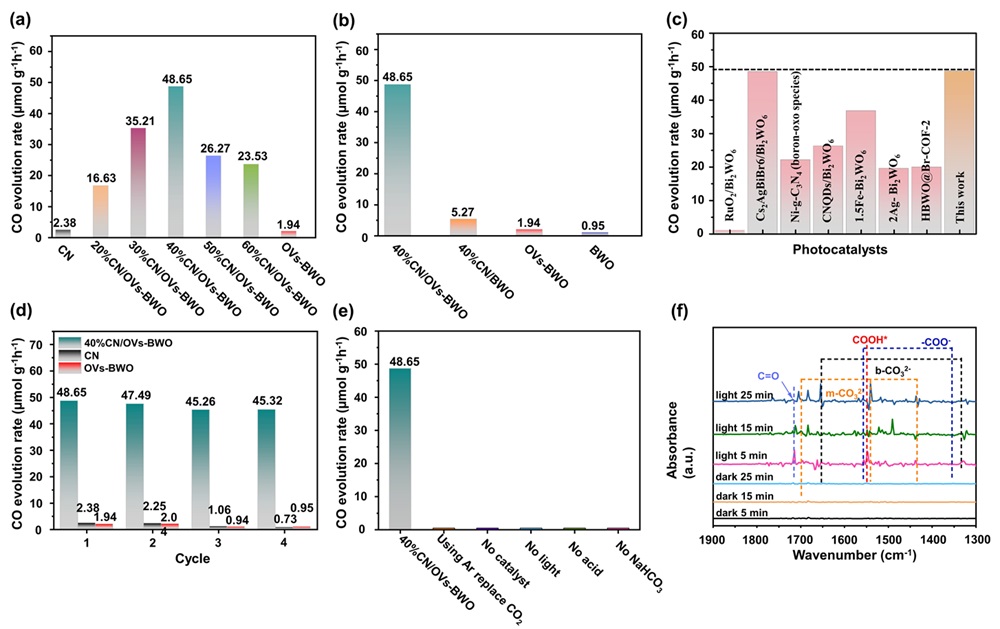
Figure 6.
(a) Comparison of the photocatalytic CO
2
conversion performance of the CN/OVs-BWO with different CN loading contents for CO production. (b) Comparison of the photocatalytic CO
2
conversion performance of the CN, BWO, OVs-BWO and CN/OVs-BWO for CO production. (c) Comparison of the photocatalytic CO
2
conversion of the 40%CN/OVs-BWO with the previously reported photocatalysts. (d) Recycling photocatalytic CO
2
conversion tests over CN, OVs-BWO and CN/OVs-BWO. (e) CO
2
photocatalytic activity under varied conditions. (f) In situ diffuse reflectance infrared Fourier transform spectra for photocatalytic CO
2
conversion over 40%CN/OVs-BWO.
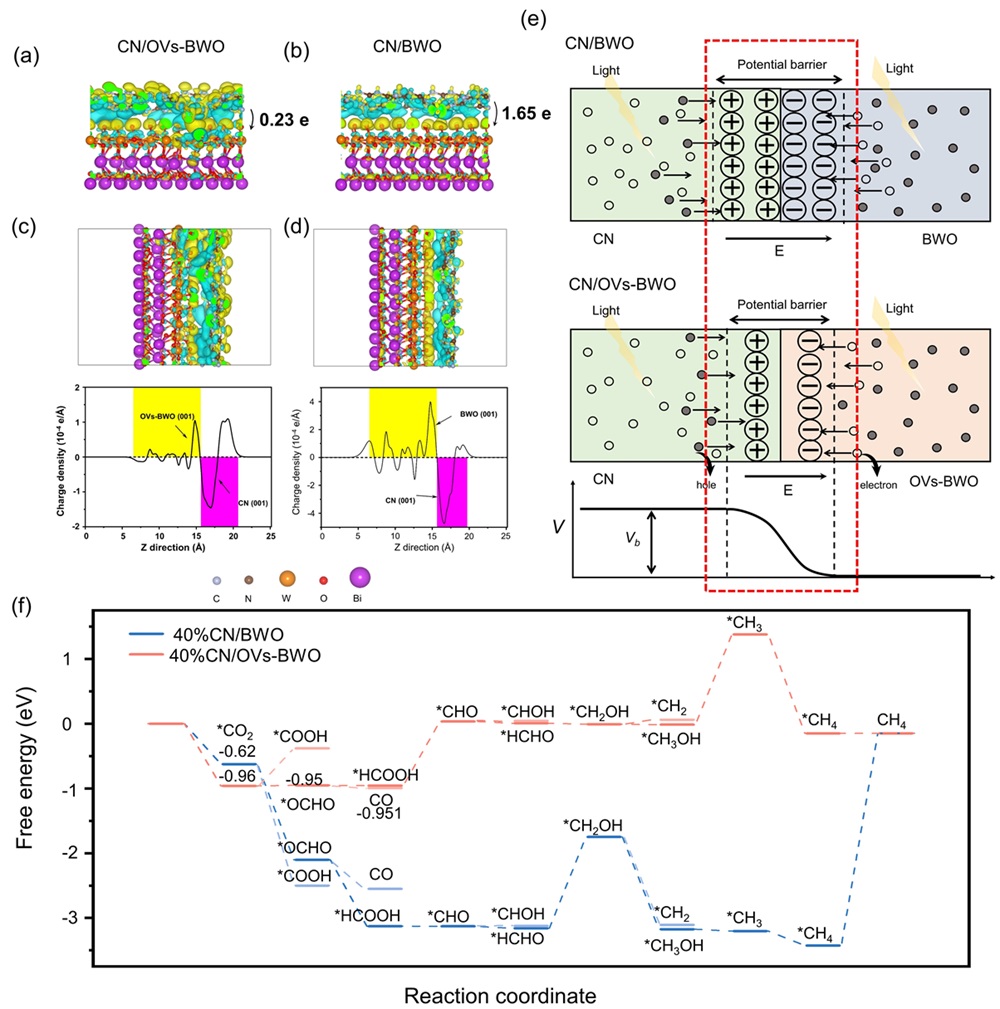
Figure 7.
(a, b) Side view of CN/OVs-BWO (a) and CN/BWO (b). (c, d) Bader charges analysis atoms of the isosurface of CN/OVs-BWO (c) and CN/BWO (d). (e) Schematic illustration of the shrinkage of the potential barrier of CN/OVs-BWO compared to that of the CN/BWO. V
b
and E indicate potential barrier and electric field, respectively. (f) Gibbsfree energy profiles for CO
2
photoreduction on CN/OVs-BWO and CN/BWO.