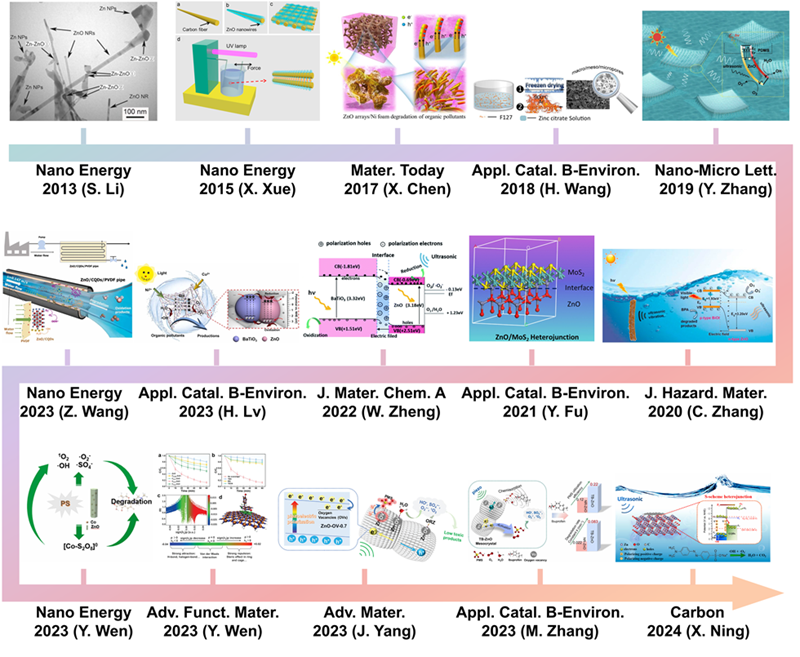
Fig. 2. Different strategies for enhancing the piezocatalytic performance of the ZnO-based catalysts. These inset figures are reproduced from ref. [
Fig. 4. (a-c) Microscopic (FESEM) images of ZnO nanoparticles (in particular nanorods), 1D microwires and multipods-like microparticles. MB degradation at 20 kHz (d) and 858 kHz (e) ultrasound in the presence of ZnO nanoparticles (ZnO-np), 1D microwires (ZnO-mw) and multipods-like microparticles (ZnO-mps) and without ZnO particles. Reproduced from ref. [
Fig. 5. (a-g) Schematic illustration of the two-step fabrication process of the vertically aligned ZnO NW array on a polymer matrix. (h) Picture of the as-prepared ZP film (1 × 1 in.2). Scale bar: 1 in. (i) Degradation curves of the MB dye in the presence of an ultrasonic field and UV light irradiation. (j) Schematic diagram of the piezo-photocatalytic mechanism. Reproduced from ref. [
Fig. 6. (a) SEM image and (b) HRTEM image of the GZn/PQz composite. (c) The oxidation of IBF by piezoelectric catalysis with different doses of GZn/PQz catalyst. (d) General mechanism of IBF oxidation over GZn/PQz as piezoelectric catalyst, photocatalyst, and piezo-photocatalyst. Reproduced from ref. [
Fig. 7. (a) Piezo-photocatalytic mechanism of 2% BTO//ZO JNM under stir + light irradiation. Reproduced from ref. [
Fig. 8. (a) Schematic illustration of lattice structure of ZnO/MoS2 heterojunction. (b) MO degradation efficiencies under different conditions. Energy band diagrams of ZnO/MoS2 without stirring (c) and under stirring (e). The migration of photogenerated charge carries and production of reactive oxygen species under sole sunlight irradiation (d) and stirring-sunlight irradiation (f). Reproduced from ref. [
Fig. 9. (a) Illustration of the synthesis process of the ZnO/Cs2AgBiBr6 nanorod array. (b) Degradation efficiencies of RhB using ZC0.5 under different situations (visible light, simulated sunlight, visible light with stirring, simulated sunlight with stirring) and (c) corresponding calculated k values. (d) Proposed mechanism of piezoelectric field and photosource-modulated photocatalysis of ZnO/Cs2AgBiBr6 S-scheme heterojunction, (i, ii) ZnO under visible light irradiation (λ > 420 nm) and (iii, iv) ZnO under simulated sunlight irradiation in ZnO/Cs2AgBiBr6 S-scheme heterojunction under opposite piezoelectric field directions. Reproduced from ref. [
Fig. 10. (a, b) TEM images of C-ZnO nanorods. (c) Element mapping images of C-ZnO nanorods. (d) The results of piezoelectric potential distribution in ZnO and C-ZnO simulated by the finite element method. (e) The degradation of BPA over C-ZnO. Reproduced from ref. [
Fig. 11. (a) Schematic of the fabrication process of the asymmetric Au-ZnO and the symmetric Au-ZnO nanorod array. (b) Piezo-photocatalytic degradation of RhB with different catalysts, and control sample without catalysts. (c) Summarized histogram of the RhB degradation under different conditions for 75 min. (d) Mechanism of the enhanced catalytic activity induced by piezotronic effect and unique asymmetric nanostructure under light illumination and ultrasound stimulation (, Schottky Barrier; and, the conduction band energy and valence band energy of ZnO, respectively;, energy of the Fermi level). Reproduced from ref. [
Fig. 12. Mechanism of the enhanced catalytic performance via piezo-phototronic effect and the unique structure under ultrasonic wave and light irradiation (CB and VB, the conduction band and valence band of ZnO, respectively; EF, energy of the Fermi level). (a) AZA under light irradiation. (b) AZA under concurrent ultrasonic wave and light irradiation. (c) AZP under light irradiation. (d) and (e) AZP under concurrent ultrasonic wave and light irradiation. AZA, Au/ZnO/Au; AZP, Au/ZnO/Pt. Reproduced from ref. [
Fig. 14. (a) XRD patterns of undoped ZnO, 3%-Cl-ZnO, 5%-Cl-ZnO, 10%-Cl-ZnO and (b) an magnifying view of the ZnO (100) peak. The amplitude butterfly loop for (c) ZnO and (d) 10%-Cl-ZnO coated onto an indium tin oxide under ±10 V DC bias field along radial direction. (e) Schematic diagram for the catalytic mechanism of the ZnO and Cl-ZnO under different external conditions. Reproduced from ref. [
Fig. 16. (a) Profiles of free energy for catalytic oxidation of formaldehyde onto ZnO (100) surfaces. (b) The computed transitional states and intermediate state structures for catalytic oxidation of formaldehyde onto -12% ZnO (100) surface. Reproduced from ref. [
Fig. 17. In situ DRIFTS of Cu/ZnO in (a) H2/MeOH/H2O, Ar, and N2O atmospheres, (b) H2/EtOH/H2O, Ar, and N2O atmospheres, (c) H2/PrOH/H2O, Ar, and N2O atmospheres. Reproduced from ref. [