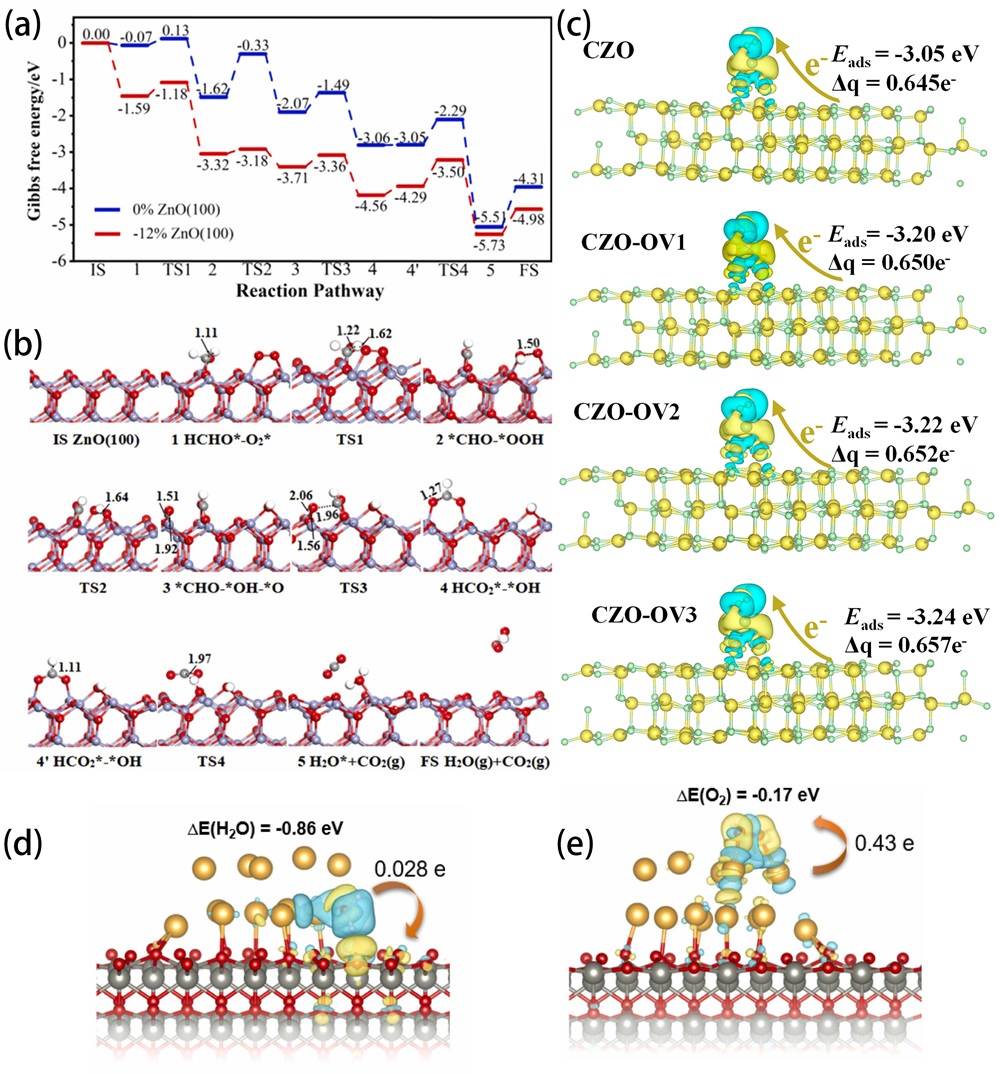
Fig. 16. (a) Profiles of free energy for catalytic oxidation of formaldehyde onto ZnO (100) surfaces. (b) The computed transitional states and intermediate state structures for catalytic oxidation of formaldehyde onto -12% ZnO (100) surface. Reproduced from ref. [214] (Copyright 2024, Elsevier B.V.). Where -12% indicates the degree of compressive strain. (c) The charge density difference of the O2 molecule on cobalt-loaded ZnO with varying oxygen vacancy concentrations (the isosurface is adjusted to 0.0005 eV; the blue electronic cloud indicates electron gain and the yellow electronic cloud indicates electron loss). Reproduced from ref. [215] (Copyright 2024, Ran et al.). (d) H2O adsorption energy on ZnO sites of Au-ZnO model. (e) O2 adsorption energy on Au sites of Au-ZnO model. Reproduced from ref. [216] (Copyright 2024, Elsevier Ltd.).
Other figure/table from this article