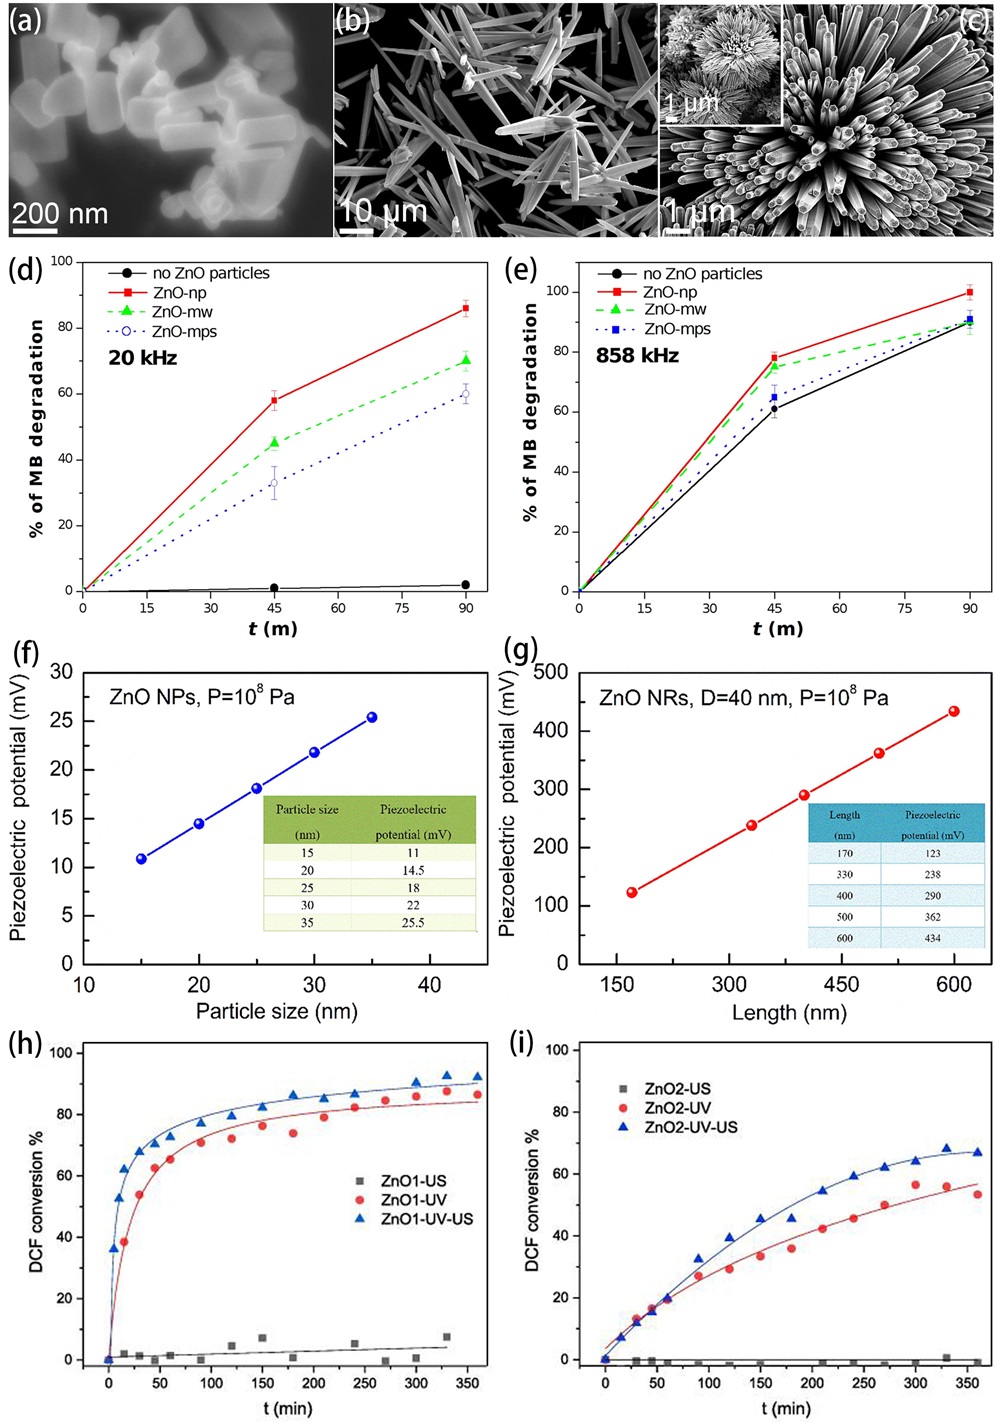
Fig. 4. (a-c) Microscopic (FESEM) images of ZnO nanoparticles (in particular nanorods), 1D microwires and multipods-like microparticles. MB degradation at 20 kHz (d) and 858 kHz (e) ultrasound in the presence of ZnO nanoparticles (ZnO-np), 1D microwires (ZnO-mw) and multipods-like microparticles (ZnO-mps) and without ZnO particles. Reproduced from ref. [145] (Copyright 2023, Troia et al.). (f) Piezoelectric potential curve versus particle size in granular nano-ZnO (ZnO NPs) under the fixed pressure of 108 Pa by COMSOL simulation. (g) Piezoelectric potential curve versus length in rod-like nano-ZnO (ZnO NRs) under the fixed diameter of 40 nm and cavitation pressure of 108 Pa by COMSOL simulation. Reproduced from ref. [146] (Copyright 2020, Elsevier Inc.). DCF conversion degree using ZnO1, i.e. ZnO nanorods (h) and ZnO2, i.e. star-shaped clusters (i) under ultrasound (US), ultraviolet light (UV) and both of them (UV-US). Reproduced from ref. [147] (Copyright 2021, Meroni et al.).
Other figure/table from this article