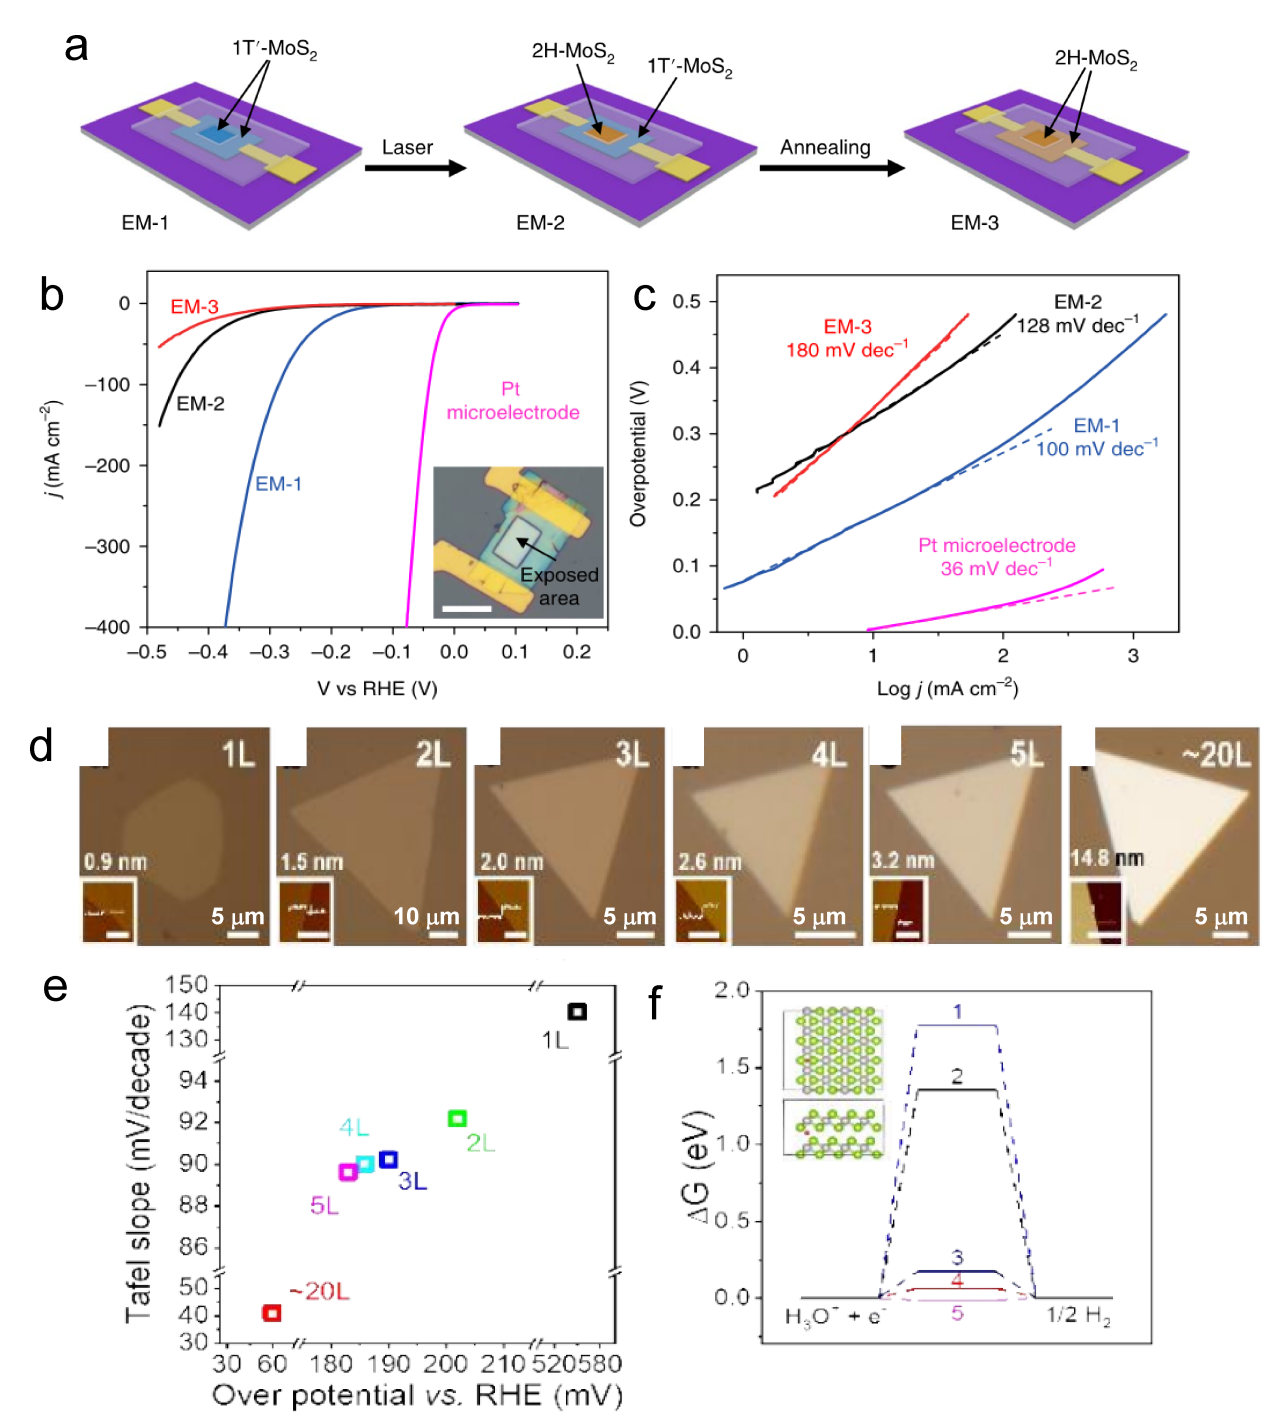
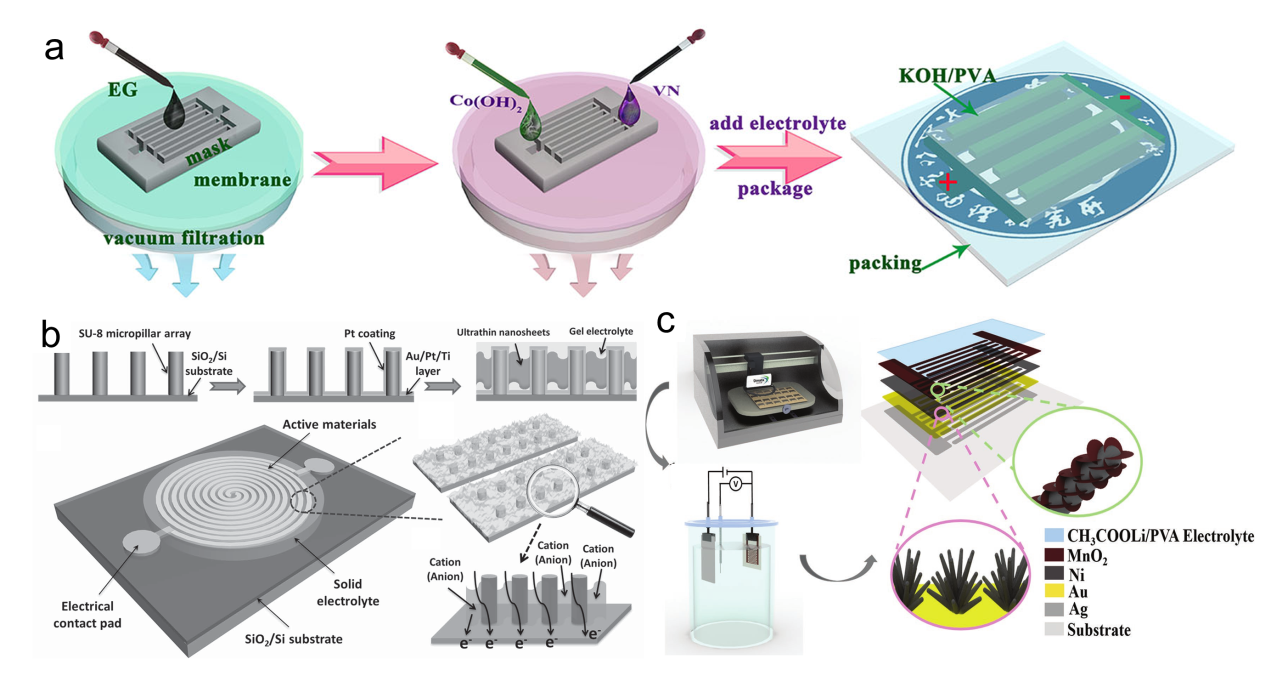
Figure 5. The diagram of fabrication process. (b) The LSV for EM-1, EM-2, and EM-3, with an inset image EM-1, the overpotential of EM-1 and EM-2 is 165 mV and 200 mV, respectively. Scale bar, 20 μm (c) Tafel plots corresponding the (b).[82] Copyright 2018, Nature Publishing Group. (d) Optical images of CVT-grown PtSe2 flakes ranging from 1 to 20 layers, insets show the corresponding AFM images. (the same height scale for AFM images, the scale bar of first is 1 μm, others is 0.5 μm) (e) LSV and Tafel slops for the HER. (f) ΔGH diagram for HER of different layer PtSe2.[106] Copyright 2019, Wiley-VCH Verlag GmbH & Co.
Other figure/table from this article