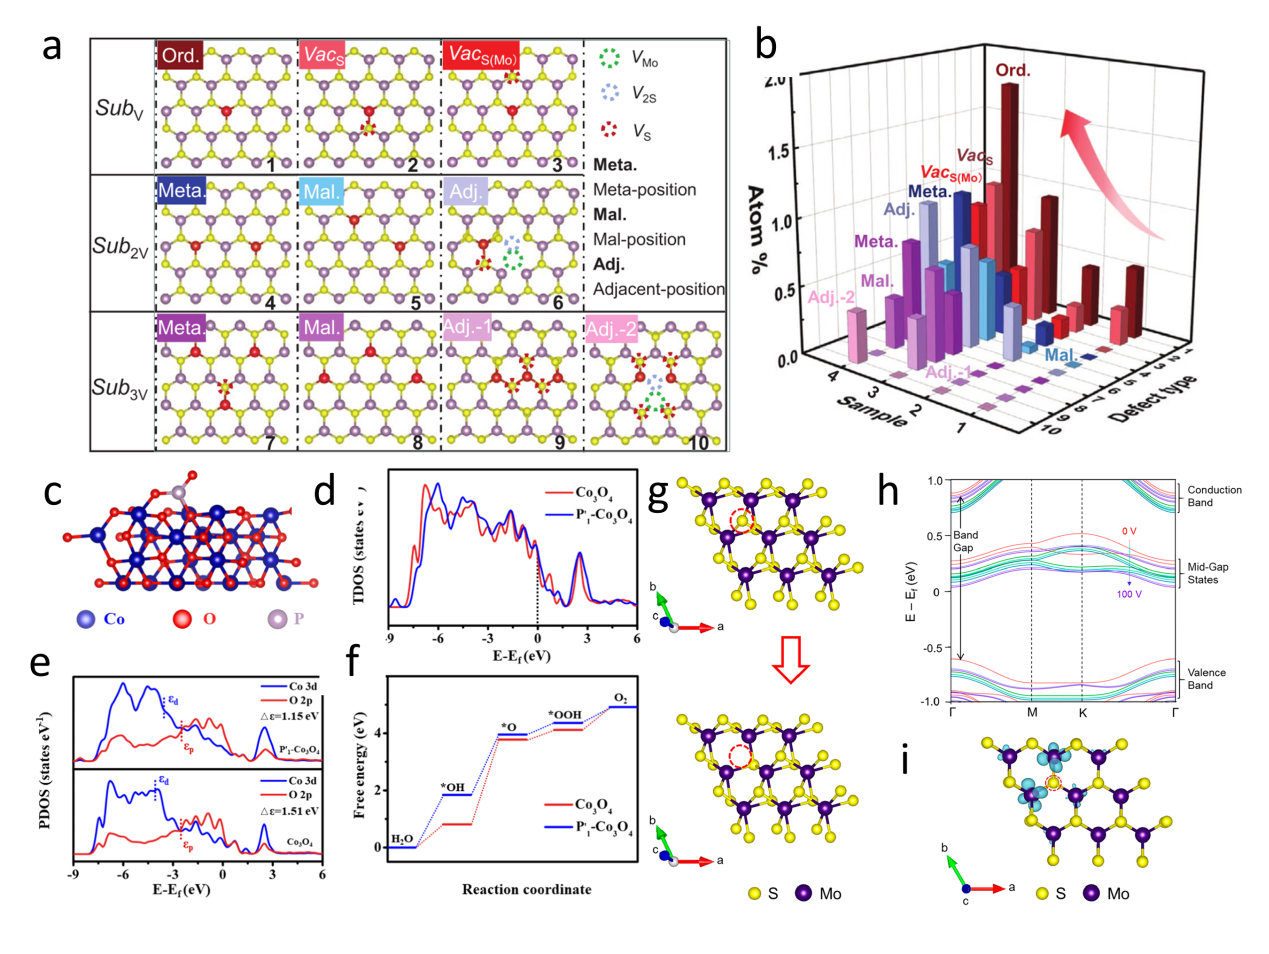
Figure 13. (a) Illustration of atomic defects observed in single-layer V-MoS2. (b) Statistical analysis of the concentration of these atomic defects.[116] Copyright 2022, Wiley-VCH Verlag GmbH & Co. (c) Structural diagram of P-Co3O4. (d) Total electronic density of states for Co3O4 and P-Co3O4. (e) Calculated PDOS of Co3O4 and P-Co3O4. (f) Calculated free energy diagram of the OER on Co3O4 and P- Co3O4.[159] Copyright 2021, Elsevier Ltd. All rights reserved. (g) The schematic of the S vacancy site created on the modeled MoS2 surface. (h) The computed band structures of the MoS2 surface with 5.5% S vacancies at various induced charge levels. (i) The charge density difference of a monolayer of MoS2 with 5.5% S vacancies.[192] Copyright 2019, American Chemical Society.
Other figure/table from this article