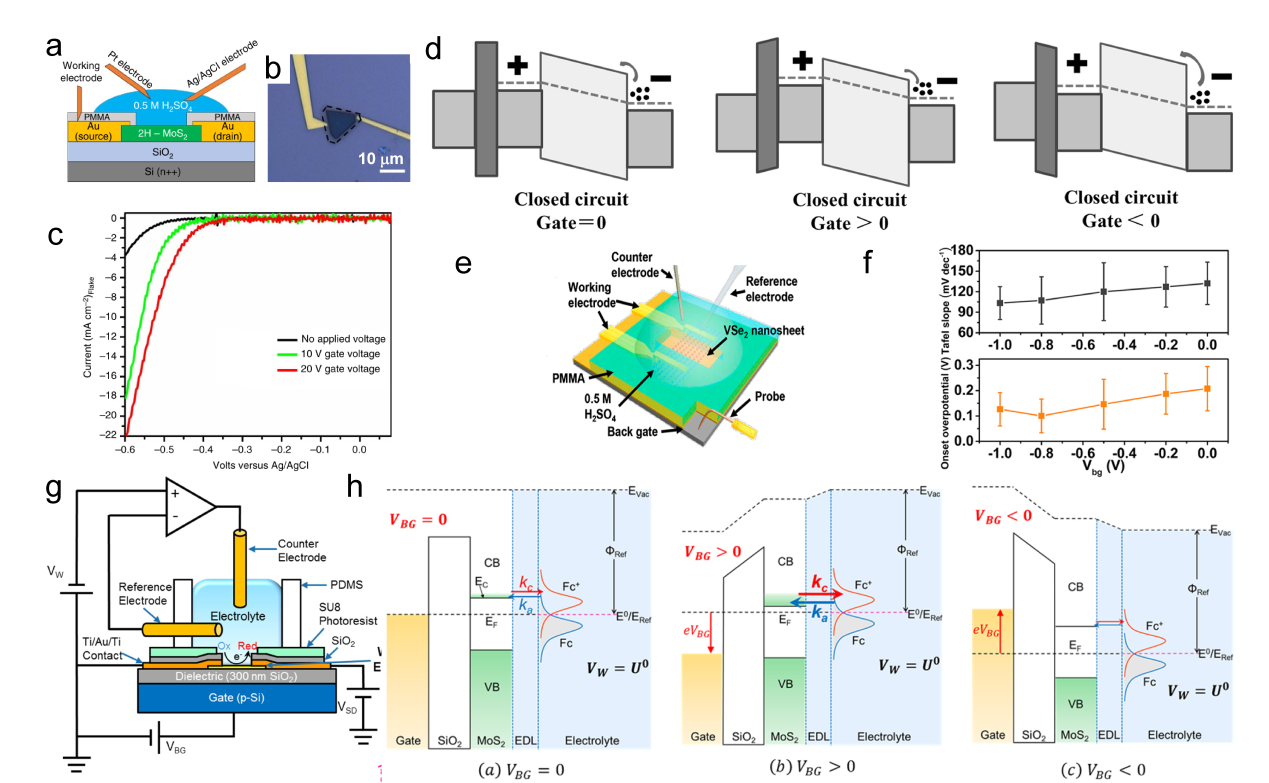
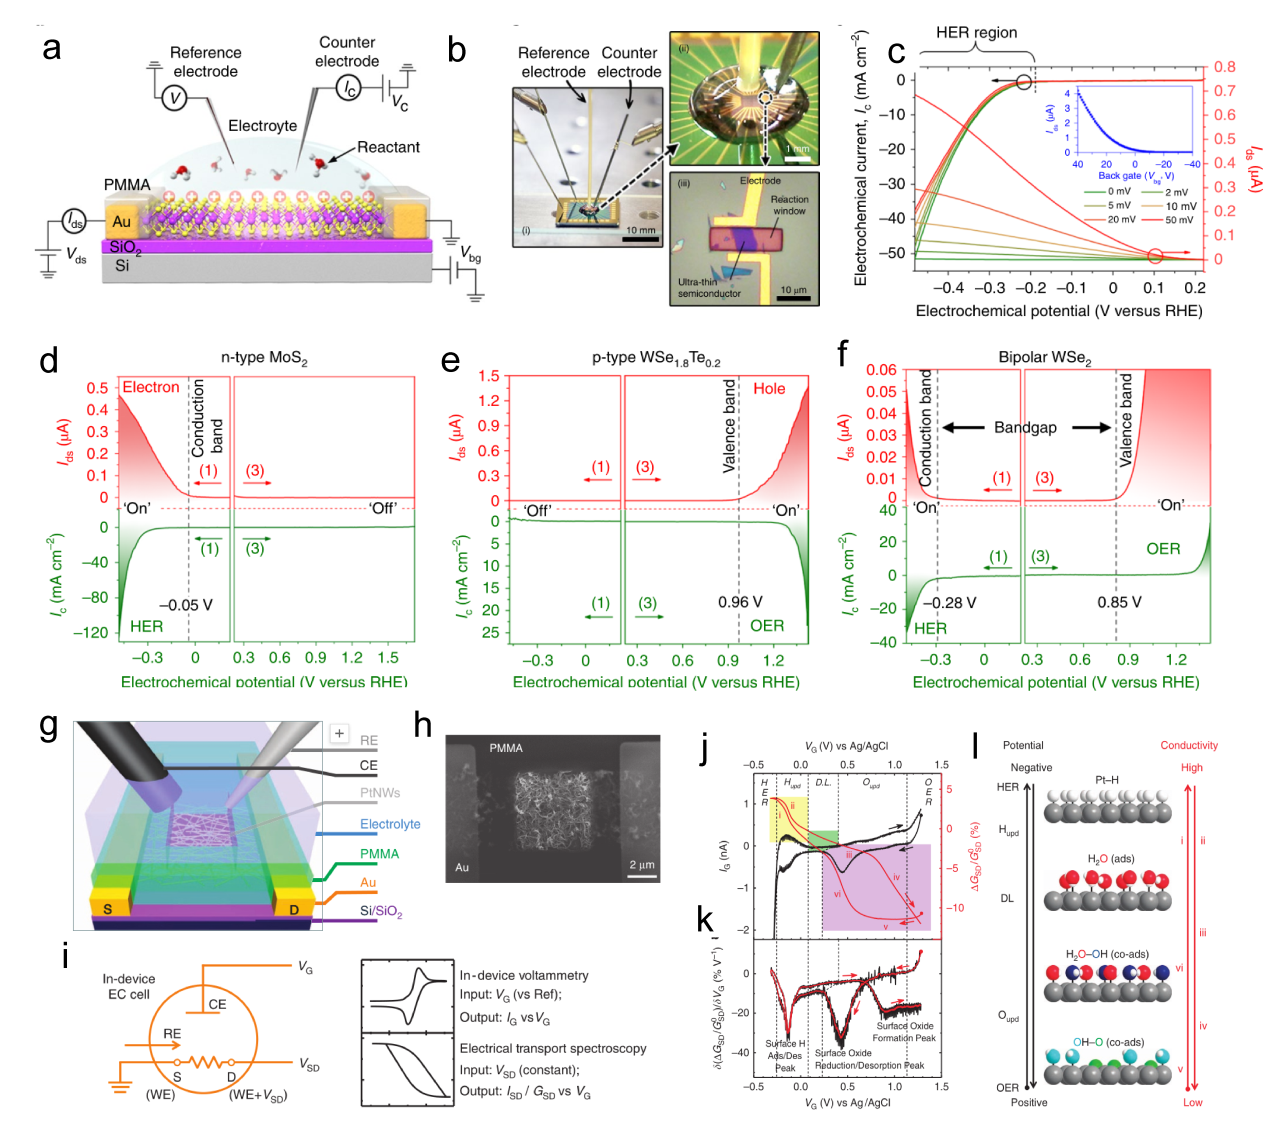
Figure 7. (a) Schematic of the gate-modulation electrochemical device. (b) Optical images of 2H-MoS2 with Au pads. (c) LSV of gate-dependent HER measurements, the green and red curves show the improvement in electrocatalytic activity after applying a positive gate voltage of 10 and 20 V, respectively.[119] (d) Energy band diagrams of the MoS2 device at different gate bias.[120] Copyright 2017, Wiley-VCH Verlag GmbH & Co. (e) Schematic of the HER device under back gate voltages. (f) Statistic-based influence of the back gate on the onset overpotential and Tafel slope.[81] Copyright 2017, American Chemical Society. (g) Schematic of a back-gated electrochemical cell. (h) Energy band diagrams of the MoS2 at various back-gate biases.[67] Copyright 2017, American Chemical Society.
Other figure/table from this article