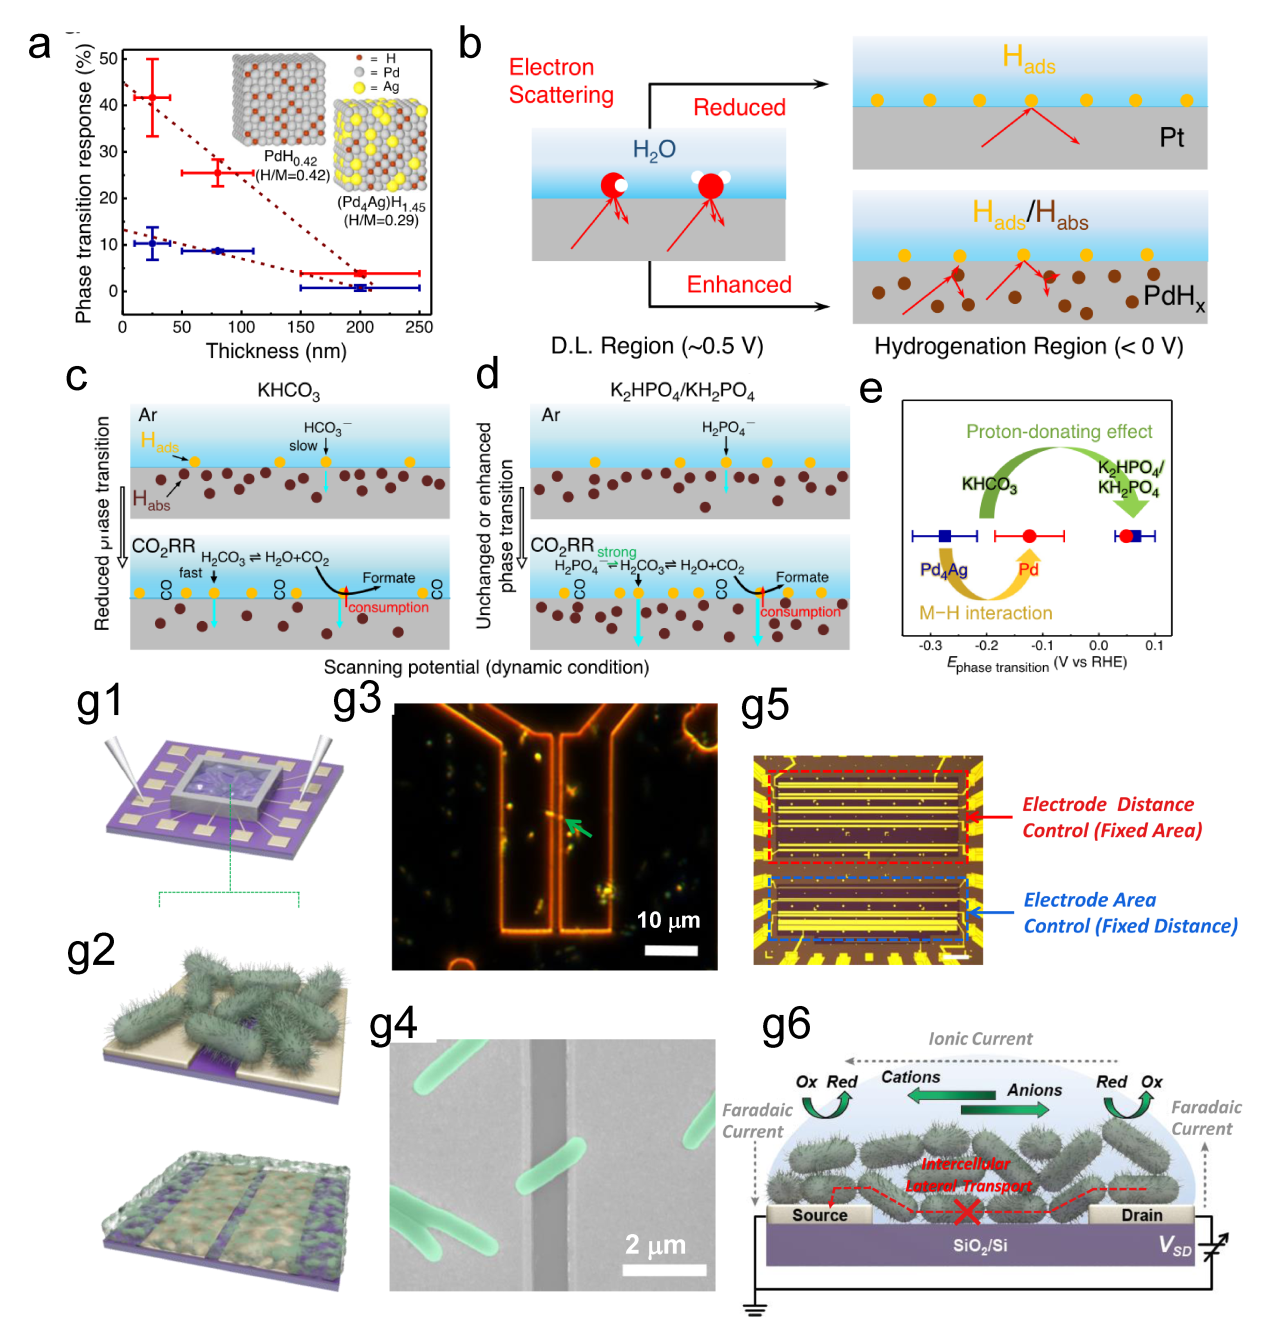
Figure 11. (a) The relationship between the thicknesses of Pd and Pd4Ag nanowire films and their phase transition responses (ΔRMHx) is illustrated on the ETS. (b) Schematic of electron scattering in metals with surface adsorbates and hydrides. A schematic of the different Pd-H states in (c) KHCO3 and (d) K2HPO4/KH2PO4 and the corresponding CO2RR processes at the interfaces. (e) Summary of phase transition potentials of Pd and Pd4Ag under CO2RR conditions in KHCO3 and K2HPO4/KH2PO4 obtained at 10 mV/s.[172] (g1, g2) Schematic of the nanoelectronic measurement setup. (g3) Optical microscope (OM) image of MR-1 in dark-field mode. (g4) An ex situ SEM image of MR-1. (g5) Schematic of biofilm measurements. (g6) Schematic of the electrochemistry model at the interface of Shewanella oneidensis MR-1.[173] Copyright 2016, American Chemical Society.
Other figure/table from this article